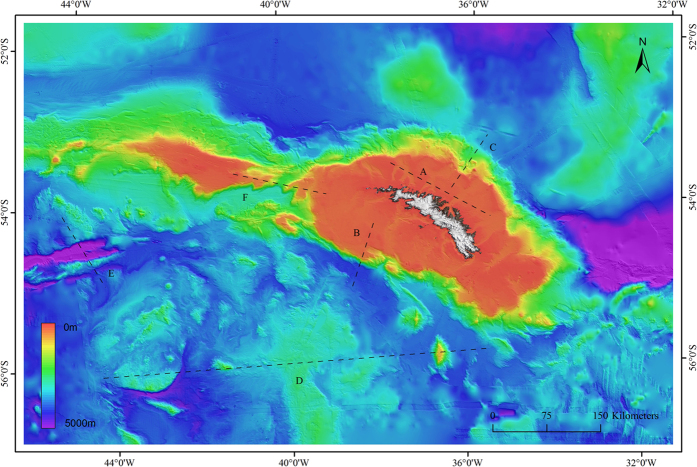
Figure 3. New bathymetric compilation for South Georgia gridded to a spatial resolution of 100 m.
Transects (A–F) denote depth-profile plots shown in Supplementary materials Fig. 1. Figure was created using ArcGIS (version 10.1 [www.esri.com/software/Arcgis]) TOPOGRID (Spatial Analyst Tools) to grid datasets listed in Supplementary materials Table 1.

