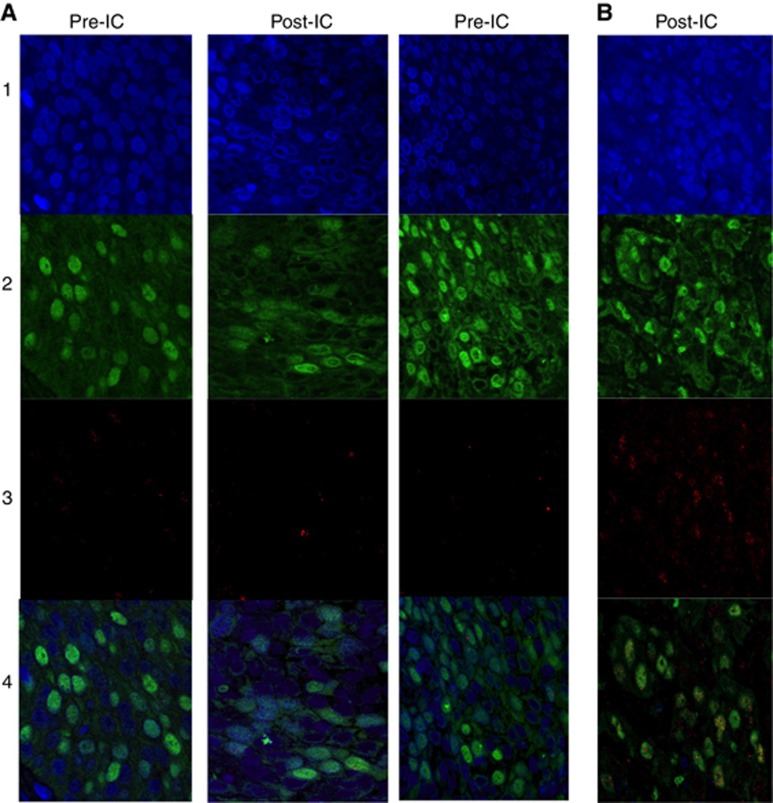
Figure 1.
Shows typical example of confocal images with immunofluorescence for DAPI (blue, 1), geminin (green, 2) RAD51 (red, 3) and overlaid (4). (A) (RAD51-negative tumours) shows similar proportion of geminin positive with Rad51 foci in post-IC compared with pre-IC images and (B) (RAD51-positive tumours) shows increased proportion of cells with RAD51 foci in post-IC images.

