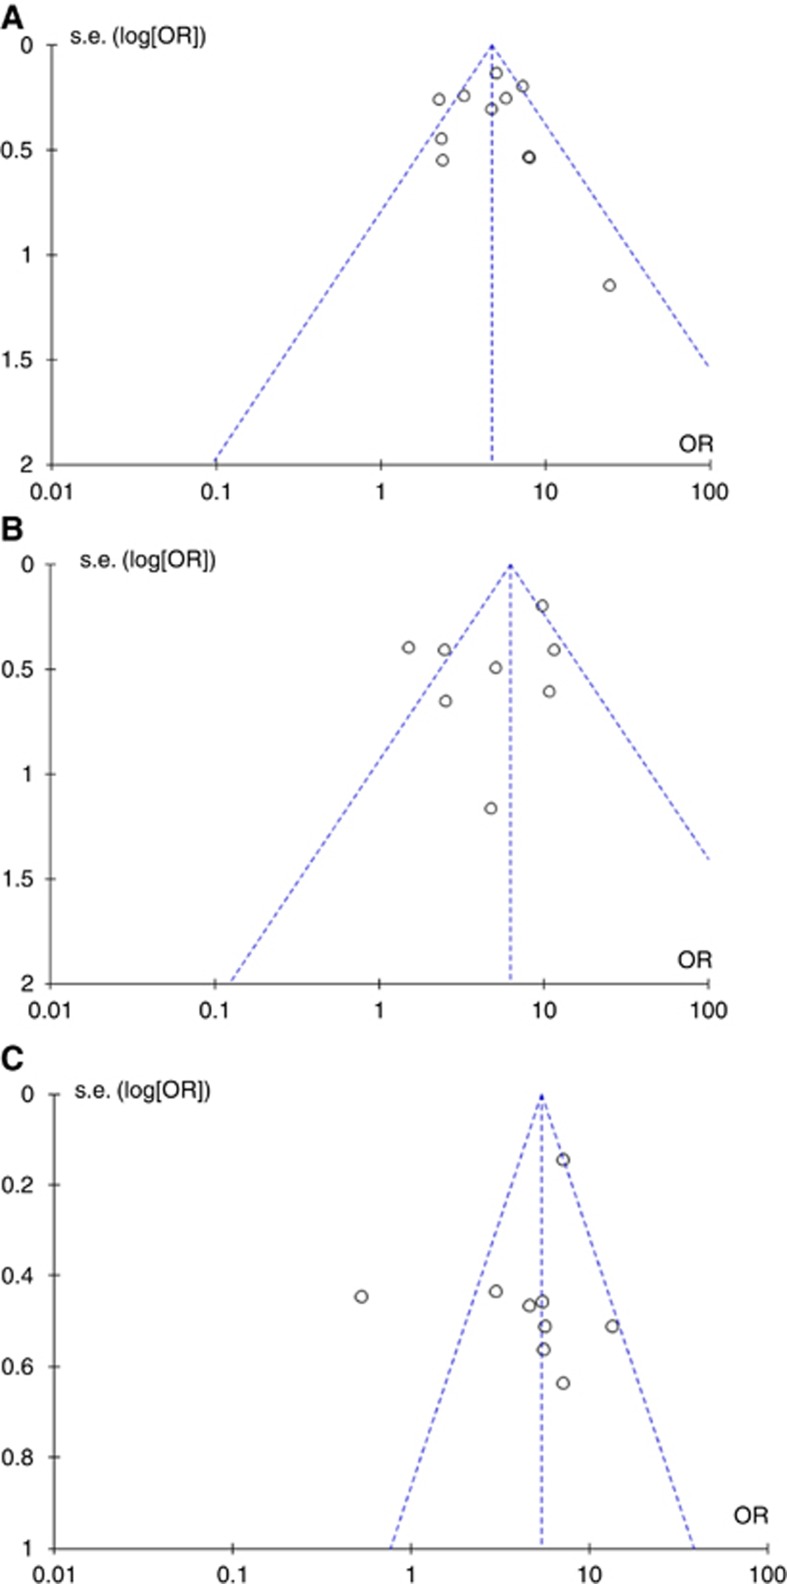
Figure 6.
Funnel plots for visual inspection of publication bias. Each point represents a standardised comparison of a separate study, comparing the outcome effect (OR) with the standard error of its logarithm (SE(log[OR])). (A) Lymph node metastases, (B) recurrence, (C) 5-year cancer-related death.

