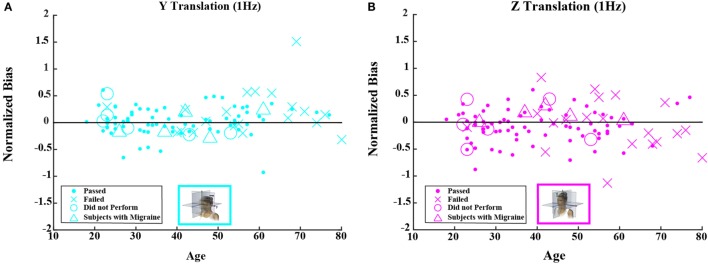
Figure 5.
Normalized bias data for all subjects are plotted versus age for (A) 1-Hz y-translation and (B) 1-Hz z-translation. Closed circles (●) show data for subjects who passed the balance test. Cross mark (X) show data for 20 subjects who passed condition 3 but did not pass condition 4 of the balance test. Open circles (○) show data for six subjects who did not attempt the balance test. Triangles (Δ) show data for five migraineurs. Format mimics Figure 3.

