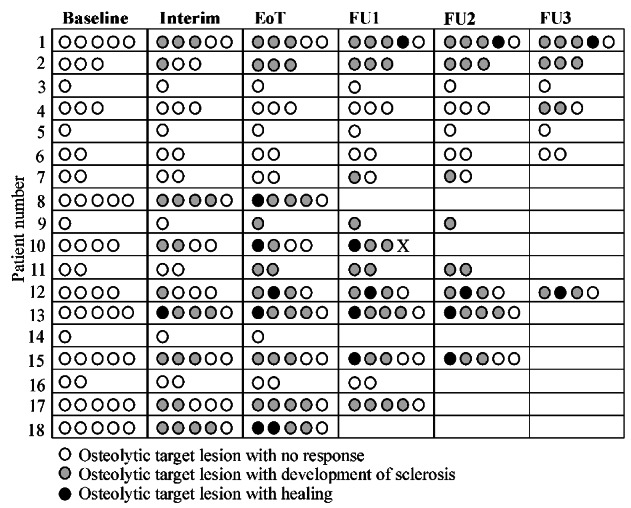
Figure 2.

Sclerosis and healing of osteolytic target lesions. Time of development of sclerosis or healing of the 56 osteolytic target lesions observed in 18 patients. The number is the patients’ identification number and each patient had between one and five target lesions. The circles illustrate the target lesions and the color of the circles represent the status at different time points. Each row shows different time points from baseline to the interim assessment, end of treatment and follow-up. Boxes without circles indicate missing scans. Note the variability of responses in individual patients. Open circles: no sclerosis. Gray circles: sclerosis. Black circles: healing. X: osteolytic lesions excluded due to vertebroplasty. EoT: end of treatment; FU1, 2, 3: follow-up assessments 6, 12 and 18 months after end of treatment.
