
Figure 2. Producers have an advantage over resistant cheaters only at high densities of sensitive competitors and low densities of producers.
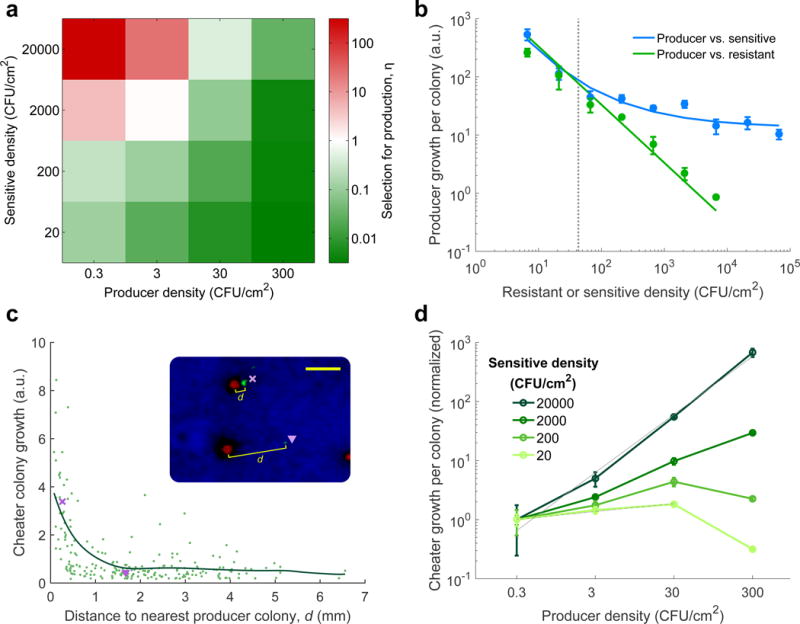
a, Selection for production relative to the non-producing resistant cheater in three-way competitions on agar for varying seeding densities of sensitive and producer cells (producer density [P] = cheater density [C], mean of 4 replicates). b, Mean growth of producer colonies (arbitrary units) in pairwise co-culture with sensitive competitors (blue) versus resistant (green, line showing reciprocal fit, slope=−1). Gain from killing, measured as the difference between the two lines (arrows), appears and further increases as the seeding density of competitors increases beyond a critical density equal to 1/πri2 (dotted line). Error bars show s.d. of 3 replicate plates, [P]=0.7 CFU/cm2. c, The growth of individual cheater colonies (arbitrary units, green dots) decreases with their distance to producer colonies (d is distance to the nearest producer colony; sensitive density [S]=20,000 CFU/cm2, [P]=[C]=3 CFU/cm2; pooled data from 4 replicates; line shows smoothened average by local linear regression. Inset: example of two representative cheater colonies indicated by × and ▽ (scale bar = 1 mm). d, Mean cheater growth increases linearly with producers at high sensitive density (solid gray line shows fit, slope = 0.98 ± 0.09 at 95% c.i.), but is not helped by producers at low sensitive density (dashed gray line, slope = 0.13 ± 0.05 at 95% c.i.). Each series is normalized to the mean growth at the lowest producer density (n=4, error bars show s.d.).