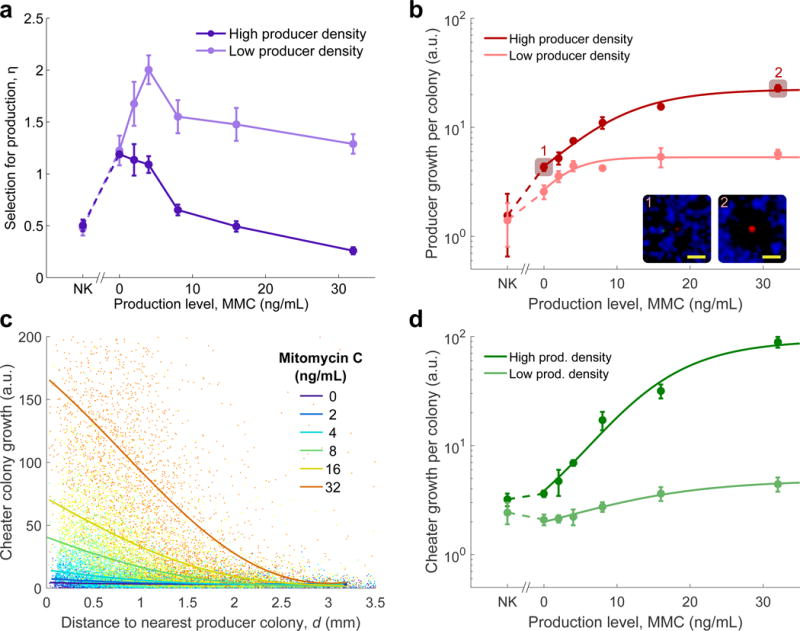
Figure 4. The advantage of producers over cheaters is maximized at an intermediate level of antibiotic production.

a, Selection for production in three-way competitions as a function of varying levels of colicin induction via mitomycin C ([S]=2,000 CFU/cm2; high density: [P]=[C]=20 CFU/cm2, low density: [P]=[C]=2 CFU/cm2; mean of 4 replicate plates for each point, error bars show s.d.). Left-most points represent no-killing (NK) controls, where the sensitive competitor was replaced with resistant. Differences between these experiments and the simulation results (Fig. 3c) may be attributable to model parameters such as production cost (Supplementary Fig. S9), grazing zone radius (Supplementary Fig. S10), cooperative toxicity (Supplementary Fig. S2), or antibiotic diffusivity (Supplementary Fig. S11). b, Mean growth (arbitrary units) of producer colonies increases monotonically with production level (n=4, error bars show s.d.). Insets: representative colonies from highlighted data points. c, Growth (arbitrary units) of individual cheater colonies close to producer colonies increased with colicin induction (each series is pooled data from all replicates in the high [P] condition; solid lines are smoothened averages calculated by local linear regression). See Supplementary Fig. S12 for low [P] data. d, Mean growth (arbitrary units) of resistant colonies at low and high producer density for varying production levels (n=4, error bars show s.d.).
