
Figure 3.
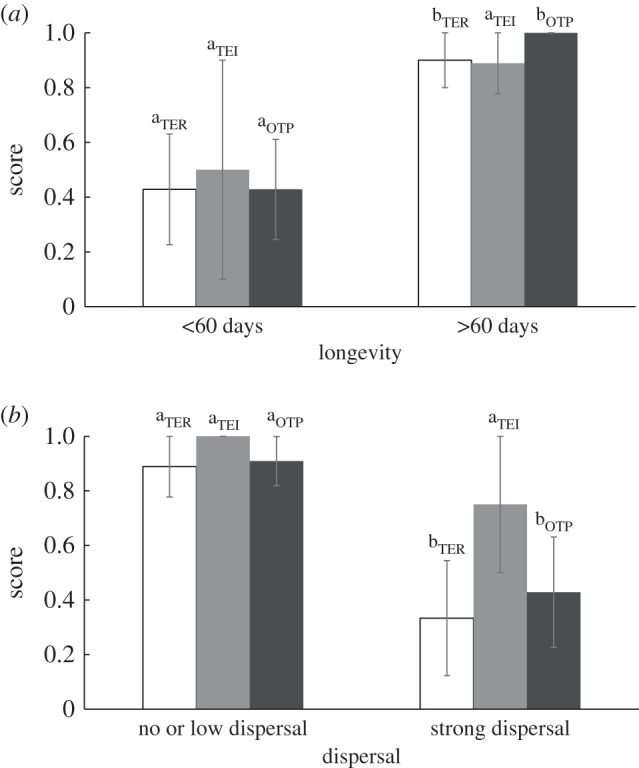
Scores for transgenerational effect on resistance (TER, white bars), transgenerational effect on immunity (TEI, grey bars), and overall transgenerational protection (OTP, black bars) according to species longevity (a) and dispersal (b). Statistical analyses were performed separately for each group (TER, TEI, and OTP). Levels not connected by same letter are significantly different. Error bars represent ± standard error (s.e.).