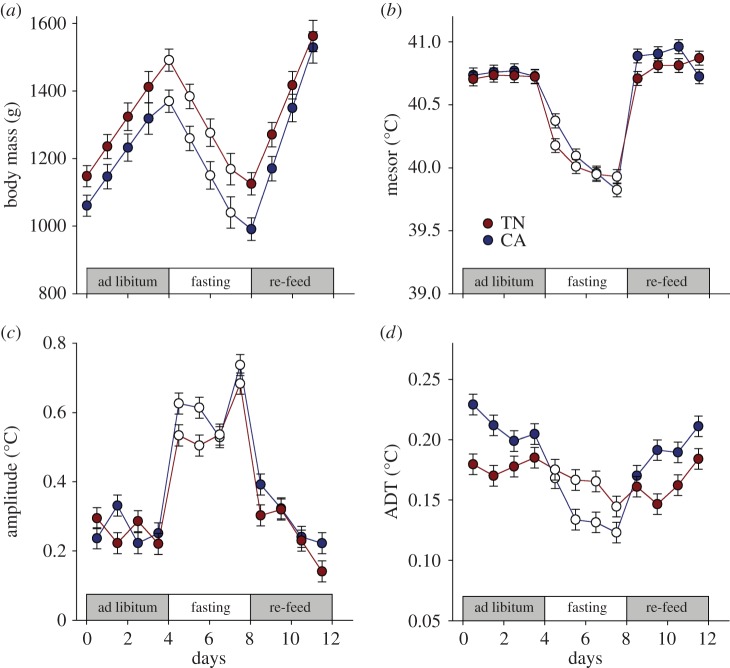
Figure 1.
Body mass (a) effects plots (mean ± model s.e.) in thermoneutral (TN) and cold-acclimated (CA) ducklings during similar durations (4 days) of ad libitum feeding, fasting and re-feeding. (b–d) Body temperature effects plots (marginal model fits ± s.e.) of TN and CA ducklings (N = 6 per temperature group) from the daily Cosinor analysis during the three different feeding conditions. Mesor results (b) reflect the daily average Tb. Amplitude (c) reflects the peak or nadir deviation from the mesor, and ADT (d) reflects the extreme short-term variation across the sampled time interval (15 min). (Online vesion in colour.)

