
Figure 4.
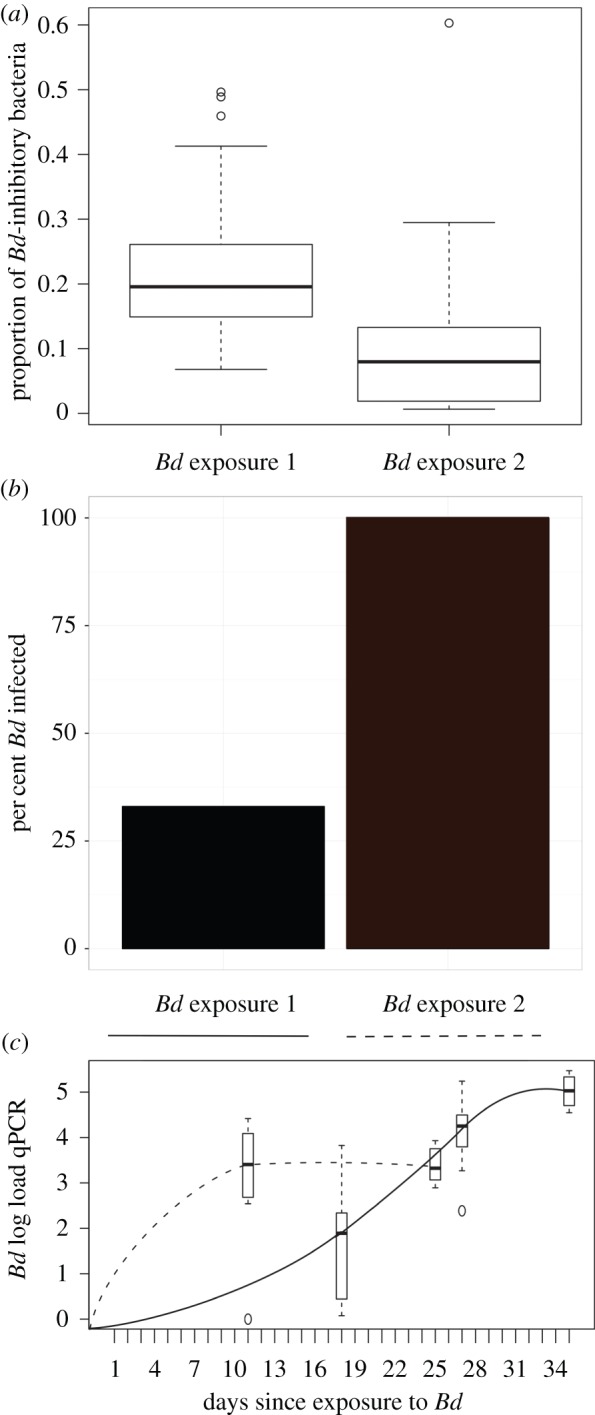
The proportion of Bd-inhibitory bacteria on captive toads, the per cent infected, and the pathogen load during the first and second exposures to Bd. (a) The proportion of sequences that match the Bd-inhibitory database found on individuals at the time of Bd exposure 1 (n = 39 toads on day 17) and Bd exposure 2 (n = 31 toads on day 138). There is a higher proportion of the skin community that is Bd inhibitory at the time of first Bd exposure than there was at the time of the second Bd exposure (ANOVA F = 16.22, p < 0.00016). (b) Of 39 toads exposed to Bd in the first trial, 13 (33%) became infected. During the second Bd exposure, 31 out of 31 (100%) toads became infected. (c) Bd load is presented as the number of log-transformed DNA copies (qPCR) through time during Bd exposure 1 (solid line) and Bd exposure 2 (dotted line). Bd load means are calculated from 13 infected individuals in exposure 1 and from 10 infected individuals in exposure 2 (these include the Bd-only infected group and excludes the J. lividum treated group which differed significantly in the second trial, see figure 5; electronic supplementary material, figure S4). (Online version in colour.)