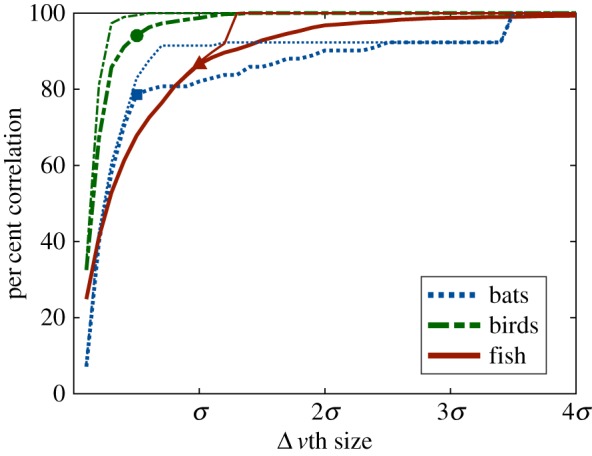
Figure 10.

The per cent correlation as a function of  for bats (blue dashed), birds (green dashed-dot) and fish (red solid) with (thin line) and without (thick line) acceleration limits applied to the DRCA optimal velocity; markers indicate values that appear in figures 9 and 11. The x-axis is scaled by the standard deviation for each species, which is 2 m s−1 for the flying species and 0.04 m s−1 for the fish.
