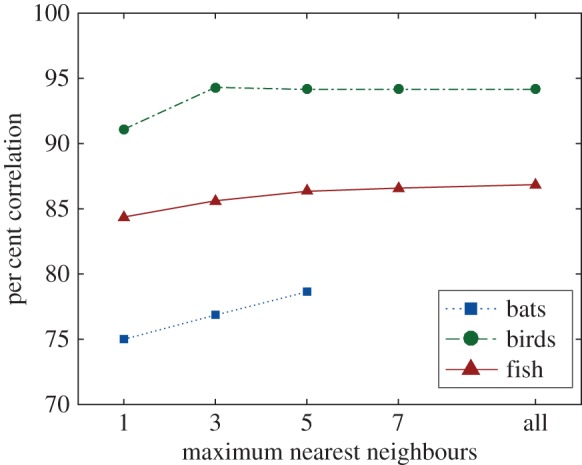
Figure 11.

The per cent correlation for bats (blue squares with dashed line), birds (green circles with dashed-dot line) and fish (red triangles with solid line) without acceleration limits applied to the DRCA optimal velocity for each species for a range of maximum topological distances ranging from one to all possible animals within the metric range (3 m for flying species and 0.3 m for fish).
