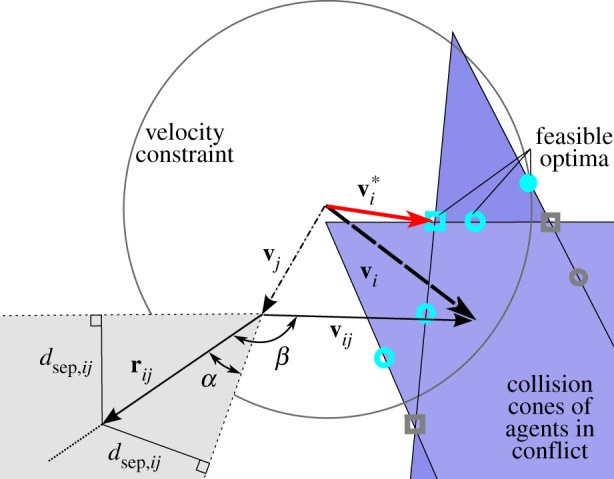
Figure 6.

The grey cone with dashed borders depicts the anatomy of a collision cone for an agent that is not in a conflict:  indicates that
  falls outside the collision cone. The blue cones with solid borders depict collision cones for agents in conflict; potential optima are shown that are within the maximum velocity constraint (cyan) and as well as those that are infeasible (grey) at locations 1 and 2 on a single collision cone (open and closed circles, respectively) and location 3 on the intersection of collision cones (square).
