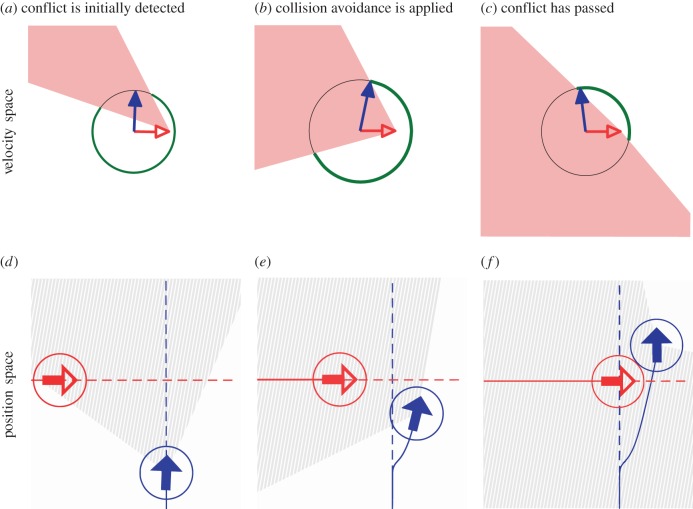
Figure 7.
The sequence of figures (progressing from left to right) shows the evolution of an encounter with one agent (blue, solid arrows) using the DRCA algorithm to avoid conflict with another agent (red, open arrows). Figures (a–c) are in velocity space showing the collision cones for the scenarios depicted in position space in figures (d–f). The circles shown in velocity space correspond to the momentary speed of the agent following DRCA; the green highlighted arcs indicate safe velocities while the regions within the collision cones correspond to unsafe velocities, denoted in position space by the hashed region.

