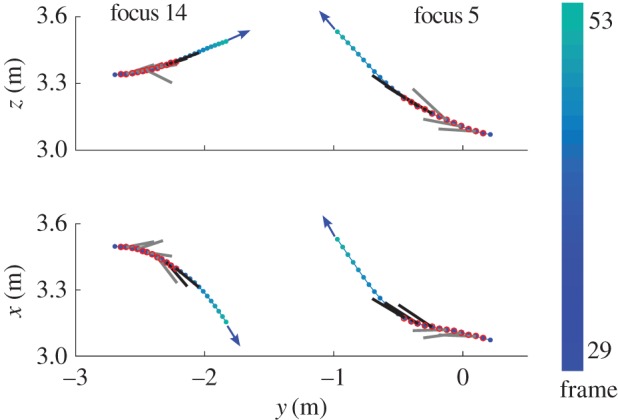
Figure 8.

Side and overhead view of two swallow trajectories (blue markers indicate positions, with colour indicating frame number) including a series of conflicts (red circled points). The DRCA optimal velocities without acceleration bounds are shown as exaggerated lines for correlated (black) and uncorrelated (grey) frames.
