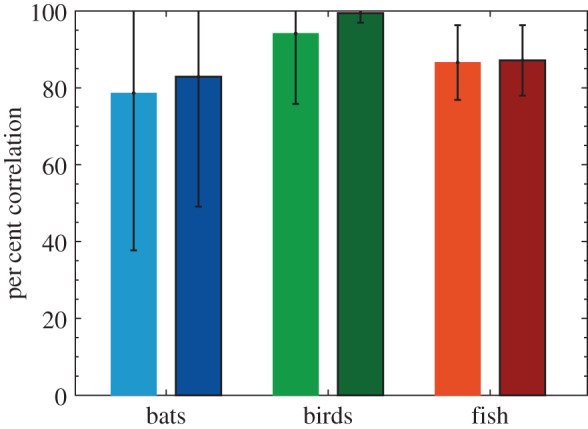
Figure 9.

The per cent correlation for each species with (darker bar with border on the right) and without (lighter bar on the left) acceleration limits applied to the DRCA optimal velocity. The error bars indicate one standard deviation above and below the mean per cent correlation (error values above 100% are not shown).
