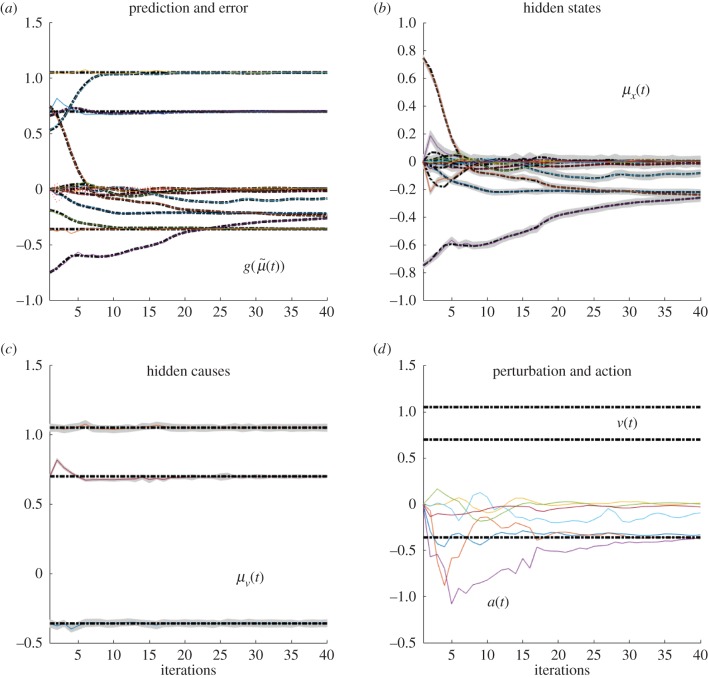
Figure 4.
Dynamics of the model internal variables in the normal case. The conditional predictions and expectations are shown as functions of the iterations. (a) the panel shows the conditional predictions (coloured lines) and the corresponding prediction errors (red lines) based upon the expected states on the upper right. (b) The coloured lines represent the expected hidden states causing sensory predictions. These can be thought of displacements in the articulatory state space. In this panel and throughout, the grey areas denote 90% Bayesian confidence intervals. (c) The dotted lines represent the true expectation and the solid lines show the conditional expectation of the hidden cause. (d) Action (solid line) and true causes (dotted line).

