
Figure 2.
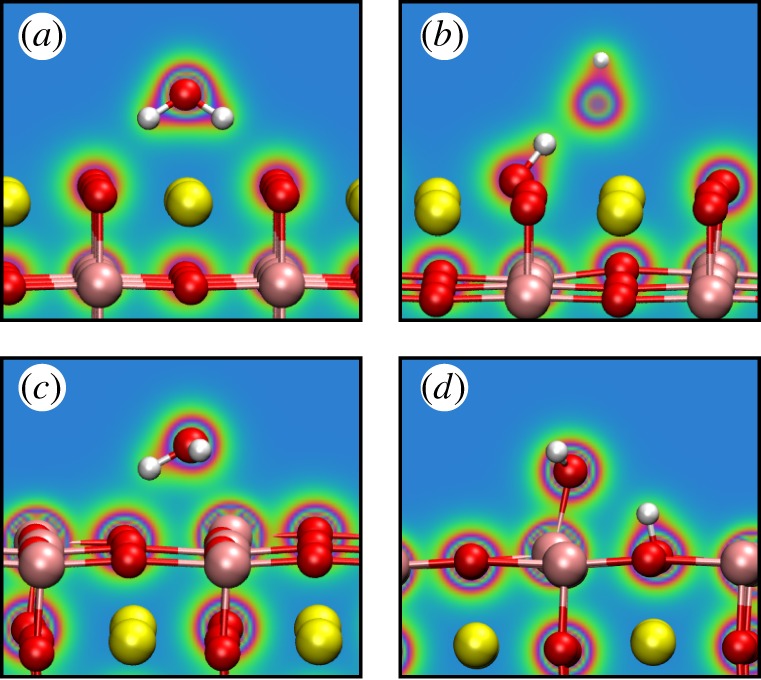
The most favourable adsorption geometries of H2O onto SrTiO3, as calculated using PBE-D3, corresponding to the energies in table 6. Colours in the plane indicate electronic charge density, with red being high and blue low. (a) Molecular adsorption onto SrOtermination, (b) dissociative adsorption onto the same, (c) molecular adsorption onto the TiO2 termination, (d) dissociative adsorption onto the same. The upper oxygen ion in (b) is behind the plane in which the electronic density is plotted. (Online version in colour.)