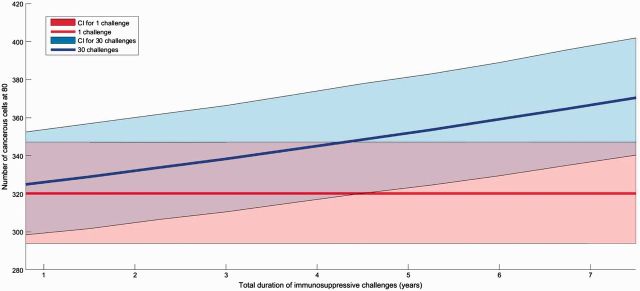
Figure 4.
Influence of the number of immunosuppressive infections on the accumulation of cancerous cells. For a total immunosuppression duration indicated on x axis (in years), red area shows that a single immunosuppressive infection has almost no influence of number of cancerous cells at the end of individual life. On the opposite, blue area shows the sharp increase in this abundance of cancerous cells when immunosuppression is distributed over 30 short infections. The maximal accumulation of cancerous cells for 30 challenges and a total duration of 7.5 years is of 370 cells. Parameters are detailed in Table 1. Areas are confidence intervals quantified by a Latin Hypercube Sampling (LHS) with 100 iterations allowing testing sensitivity for a 5% change in all parameter values and solid lines represent the median value obtained from LHS

