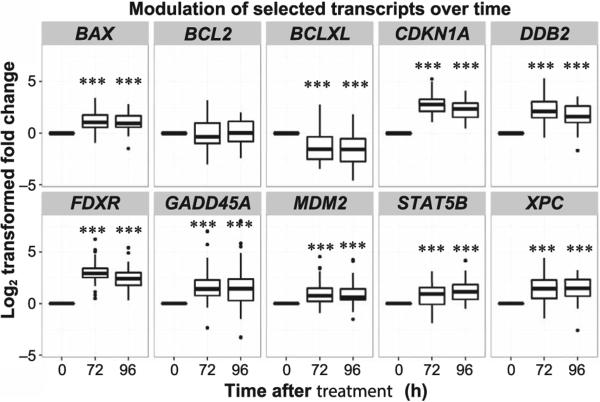
FIG. 3.
Box-whisker plots show the modulation of selected transcripts over time. This collection of plots shows the changes in gene expression at each time interval after 131I-mIBG treatment. The x-axis shows the time points sampled (0–96 h), while the y-axis shows the transformed log2 fold change of expression levels. The transcripts BAX, CDKN1A, DDB2, FDXR, GADD45A, MDM2, STAT5B and XPC show time-dependent upregulation while BCLXL shows time-dependent downregulation (paired Student's t test vs. 0 h after treatment, ***P < 0.001). BCL2 did not have a time-dependent response to radiation.

