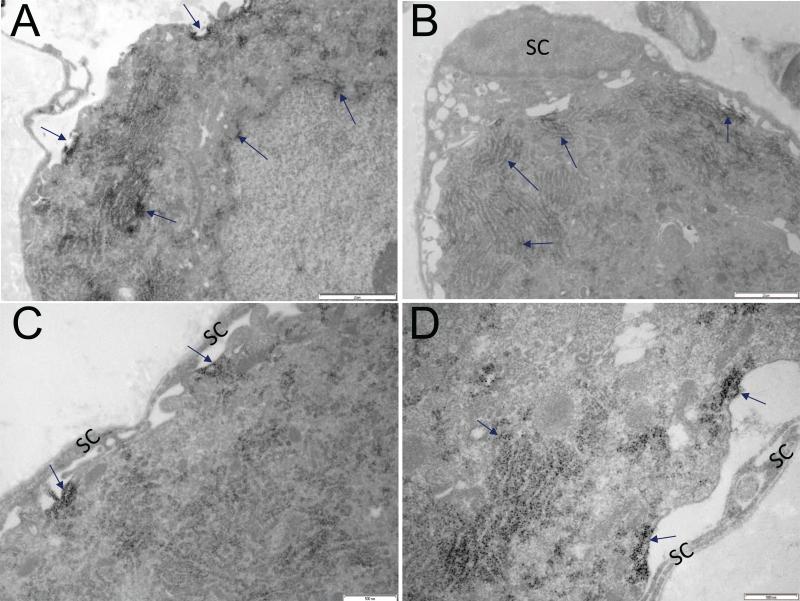
Figure 5.
Subcellular distribution of S1R in mouse DRGs A. Arrows point to S1R detected in plasma membrane, endoplasmic reticulum and nuclear envelope. Dark precipitate indicates the presence of S1R. B-D. S1R is not detected in satellite cells (SC) and their processes. Arrows point to S1R localization to the plasma membrane and endoplasmic reticulum. Scale bar: A and B = 2 μm; C and D = 500 nm.

