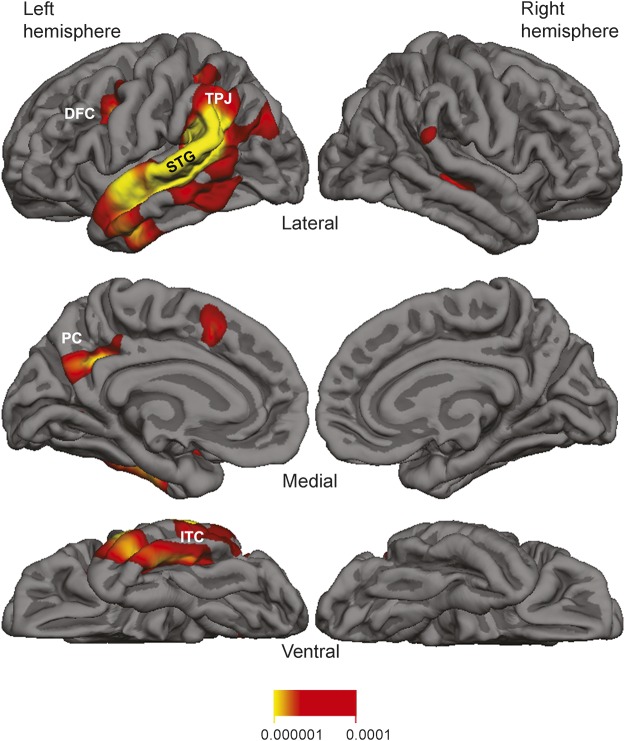
Figure 2. Group atrophy map (false discovery rate = 0.001) and quantitative morphometry for the 15 individuals with primary progressive aphasia.
DFC = dorsal frontal cortex; ITC = inferior temporal cortex; PC = precuneus; STG = superior temporal gyrus; TPJ = temporoparietal junction. Numbers below the heat map represent p values.

