. 2016 Apr 8;187(1):393–414. doi: 10.1039/c5fd00160a

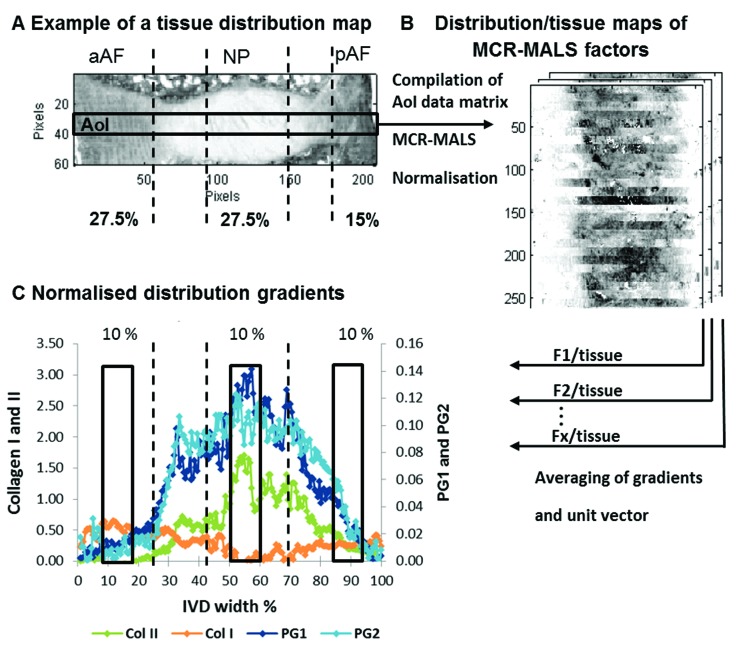
Fig. 2. Schematic representation of the extraction of multivariate FTIR parameters. Showing an example of a tissue distribution map (peak area of the 2nd derivative of the amide III peak; 1186–1297 cm–1) of a paraffin embedded goat IVD section. Black lines indicate IVD regions where an IVD is divided into zones across the width of a sagittal section (described in the section MRI T2* relaxation time mapping) (A). An area of interest (AoI) across the middle of each disc spanning the whole width of each image (10 × 208 pixels) is selected and a new AoI data matrix is generated. MCR-ALS is carried out and distribution maps of selected factors are divided by tissue distribution maps to generate relative component distribution maps (B). To be able to compare IR parameters with MRI and biochemical parameters, the relative distribution maps are further processed. Firstly, the average estimated intensity across each section is taken and secondly, the actual IVD width is determined for each section and set to unity (100%). Thirdly, areas under the curve equivalent to 10% IVD width located in the aAF (10–20%), NP (51–61%) and pAF (85–95%) regions are integrated (C).

Fig. 2