. 2016 Apr 8;187(1):393–414. doi: 10.1039/c5fd00160a

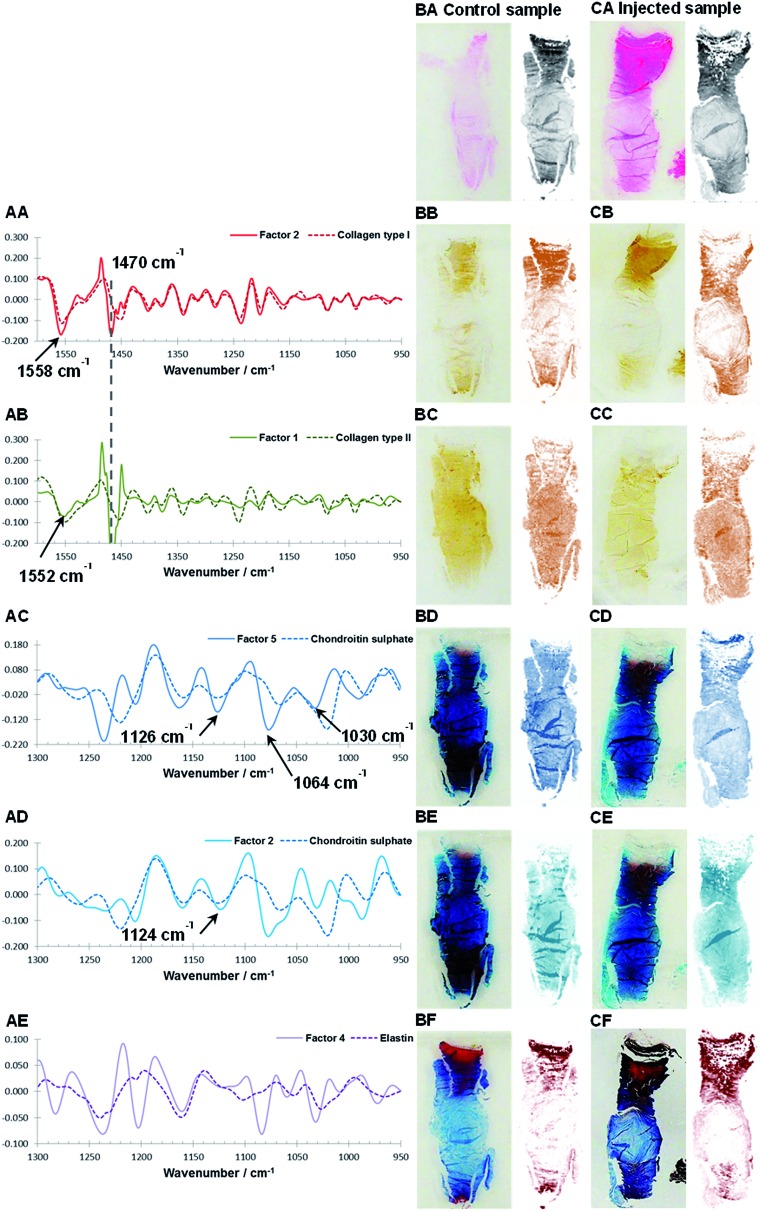
Fig. 4. Comparison of reference spectra and extracted spectral profiles after MCR-ALS decomposition of Factor 2 (950–1600 cm–1) and collagen type I (AA), Factor 1 (950–1600 cm–1) and collagen type II (AB), Factor 5 (950–1300 cm–1) and chondroitin sulphate (AC), Factor 2 (950–1300 cm–1) and chondroitin sulphate (AD) and Factor 4 (950–1300 cm–1) and elastin (AE). Consecutive sagittal sections of a non-degenerated and a mildly degenerated goat IVD stained with H&E (general structure: cytoplasm and extracellular matrix: pink, cell nuclei: purple) (BA, CA), collagen type I (BB, CB), collagen type II (BC, CC), Alican blue (PGs: blue stain) (BD, CD and BE, CE) and Masson Trichrome (collagens: blue, other connective tissues e.g. keratin and elastin: red) (BF, CF) are shown at the left. Matching tissue distribution (BA, CA) and MCR-ALS distribution maps are shown at the right as follows: Factor 2 (950–1600 cm–1) (BB, CB), Factor 1 (950–1600 cm–1) (BC, CC), Factor 5 (950–1300 cm–1) (BD, CD), Factor 2 (950–1300 cm–1) (BE, CE) and Factor 4 (950–1300 cm–1) (CF, CF).

Fig. 4