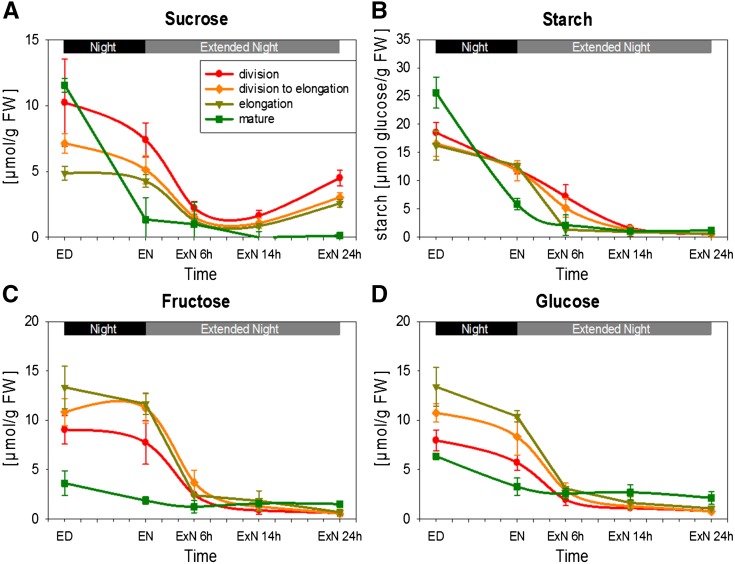
Figure 3.
Changes in major carbohydrates over the carbon starvation time course. Carbohydrate levels in the four leaf zones indicated in Figure 1A sampled over the carbon starvation time course were determined by photometric assays (see “Materials and Methods”). Starch values are given as µmol Glc units/g fresh weight. Each data point represents the mean of three biological replicates. Error bars: sd. A, Suc; B, Starch; C, Fru; D, Glc. *Indicates that the rise in Suc between 14hExN and 24hExN is statistically significant in all three growth zones (P value < 0.05). ED, End of day; EN, end of night; ExN 6h/14h/24h, extension of the night by 6 h/14 h/24 h. x axis ticks indicate 2 h intervals.

