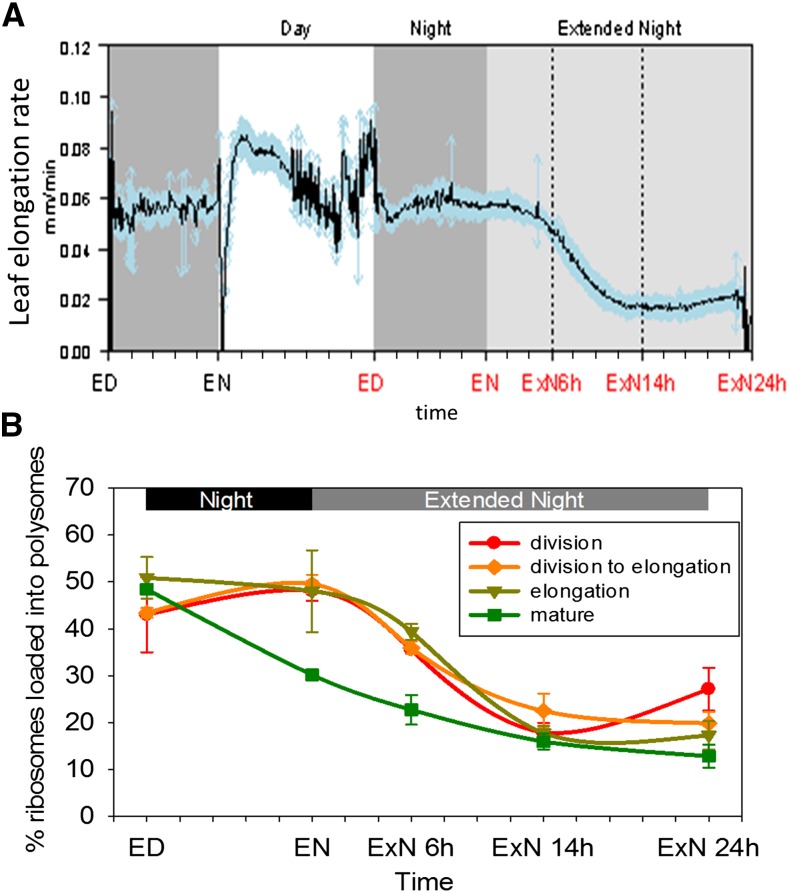
Figure 5.
Response of leaf elongation rate and polysome loading in four zones of the growing maize leaf blade to a C starvation time course. A, Leaf elongation rate of leaf 9 was measured for 10 plants with an RRT-based device (Supplemental Fig. S9A) during the same experiment when samples for metabolic and transcriptional measurements were taken. Resolution of 5 min. Mean of the 10 measured plants (black line) and sd for each time point (blue arrows) are depicted. B, Suc density gradient fractionation was used to determine in each sampled leaf zone (see Fig. 1A) the proportion of ribosomes loaded into polysomes as a proxy for protein synthesis rate. Each data point represents the mean of two or three biological replicates. Error bars: sd. ED, End of day; EN, end of night; ExN 6h/14h/24h, extension of the night by 6 h/14 h/24 h. x axis ticks indicate 2 h intervals.

