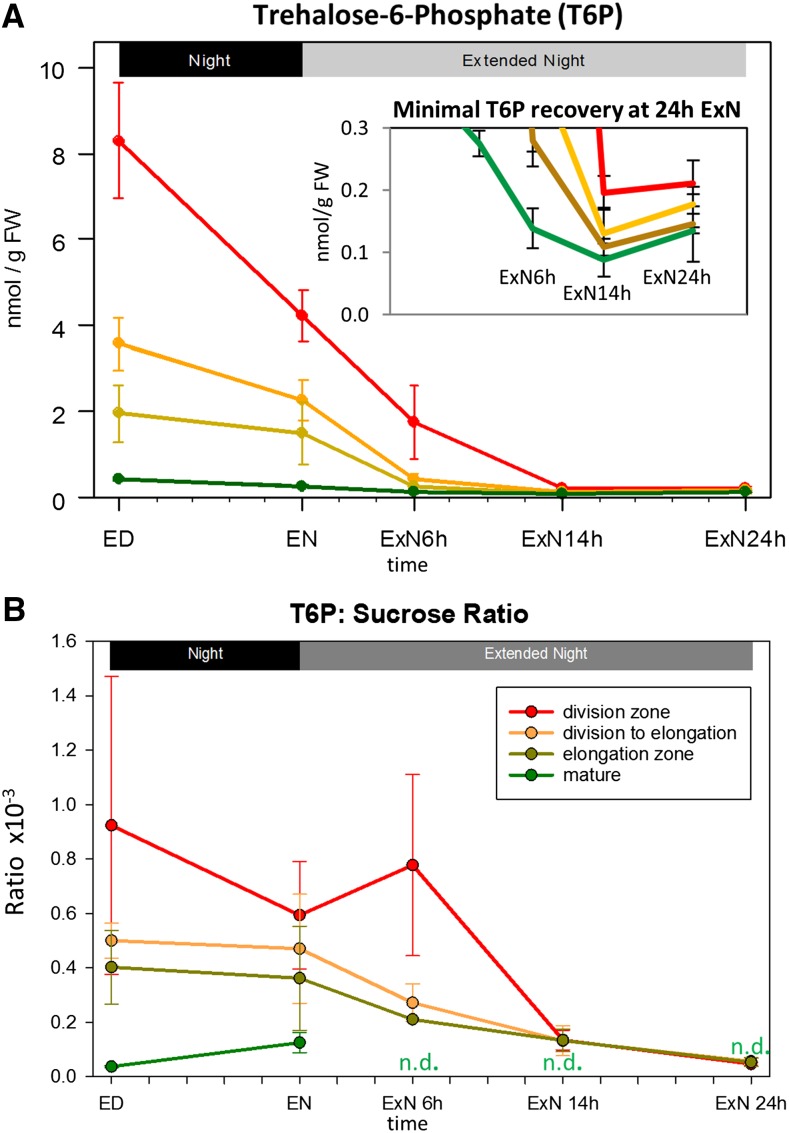
Figure 9.
The response of T6P levels and T6P:Suc ratio in four zones of the growing maize leaf to a C starvation time course A, T6P was determined in the leaf zones indicated in Figure 1A by liquid chromatography-mass spectrometry triple quad analysis (Lunn et al., 2006). Values are averages of three biological replicates; error bars: sd. Inset: Different y axis scale is used, so that small changes over the last three time points are visible. B, The ratio of T6P to Suc (Suc: Fig. 3A) was calculated for the biological replicates for each leaf region and time point (typically 3) individually. Mean and sd of these values are shown. ED, End of day; EN, end of night; ExN 6h/14h/24h, extension of the night by 6 h/14 h/24 h. x axis ticks indicate 2 h intervals. N.d., Ratio not determinable due to very low input values and high error.

