Figure 3.
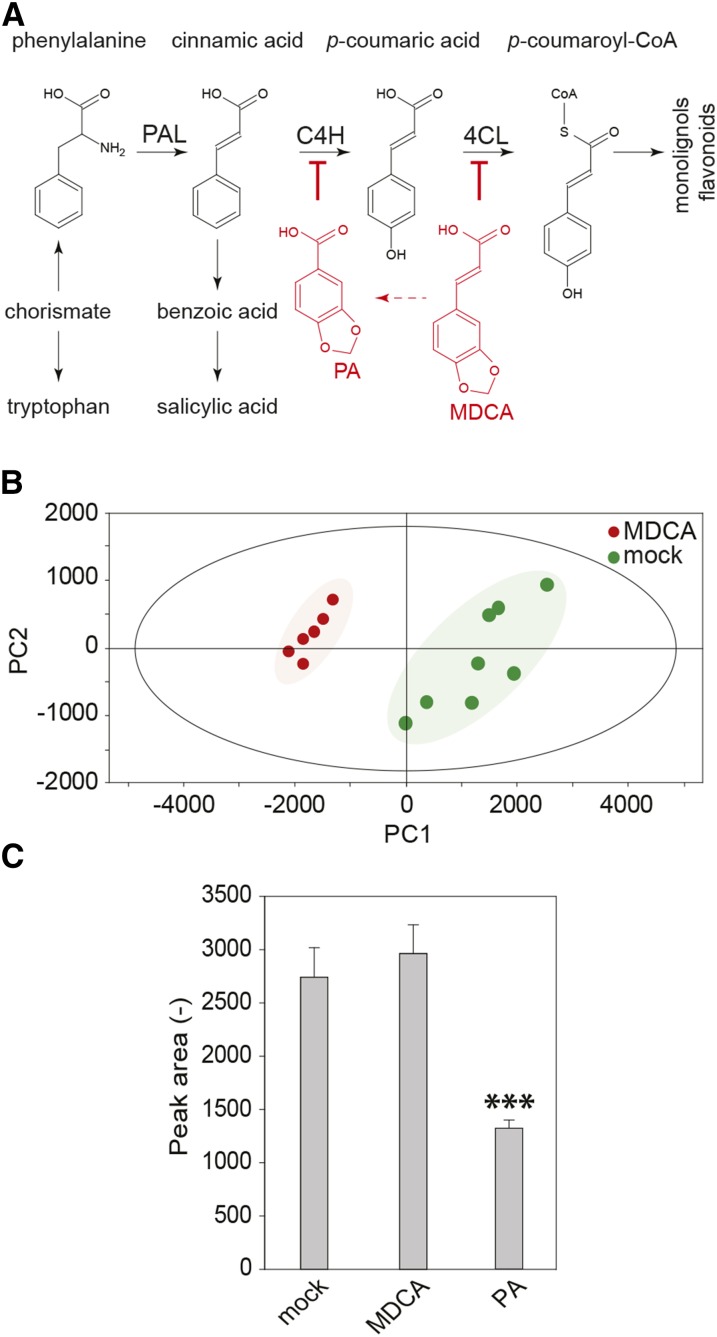
Phenolic profiling of MDCA treated Arabidopsis seedlings. A, The general phenylpropanoid pathway leading to a wide array of secondary metabolites. PA is a chemical inhibitor of C4H. MDCA is a chemical inhibitor of 4CL. The red arrow depicts the in planta processing of MDCA towards PA. B, Principal component analysis scores plot of 10 μM MDCA-treated (red) and mock-treated (green) seedlings 12 DAG. PC1 and PC2 explained 73.74% and 10.15% of the variation, respectively. Each symbol corresponds with a biological replicate representing 10 seedlings (n > 6). C, The enzymatic conversion of CA toward p-coumaric acid by C4H and potential chemical inhibition of C4H by MDCA using microsomes of yeast (Saccharomyces cerevisiae) expressing C4H of Arabidopsis. PA was used as a positive control. The product (p-coumaric acid) was detected by UHPLC-MS analysis (n = 6). Error bars represent sds. Three asterisks in (C) represent statistically significant differences compared to mock-treated microsomes (P value < 0.0001) as determined by Dunnett’s test.

