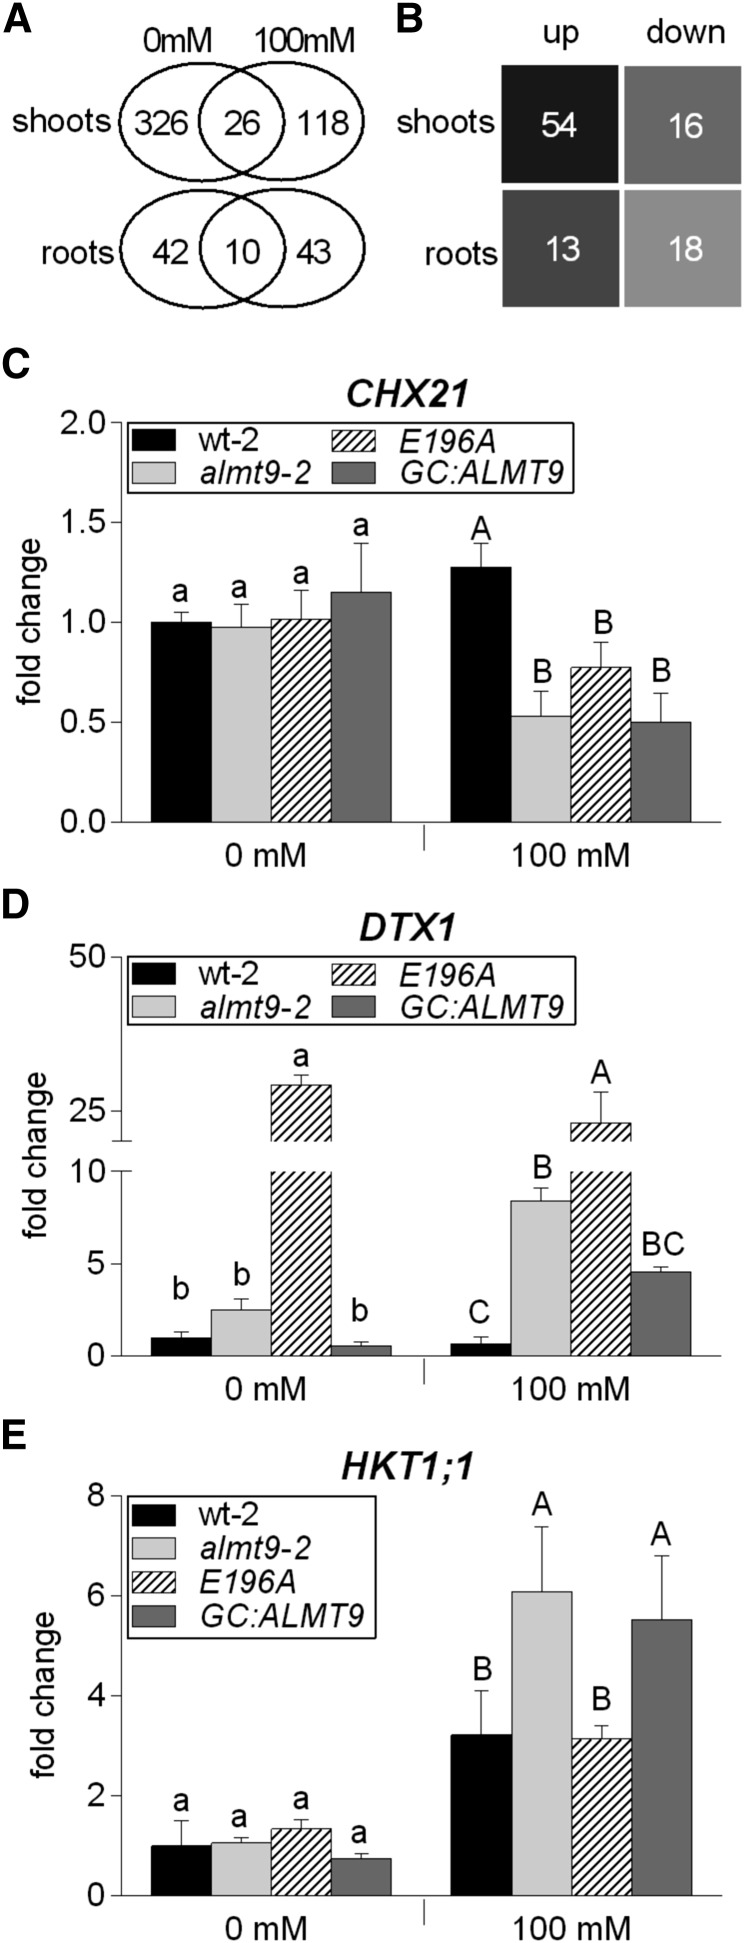
Figure 6.
Transcriptome analysis in wild-type and almt9 shoots and roots upon salinity. A and B, RNA-seq analysis of hydroponically grown wt-1 and almt9-1 plants upon exposure to control (0 mM) or NaCl (100 mM) conditions for 24 h. A, Venn diagram showing the number of differentially expressed genes between wt-1 and almt9-1 within each tissue and treatment. The overlap between the ovals represents genes that have significant changes in gene expression under both treatments. B, Number of genes that are significantly differentially expressed between both genotypes exclusively under salinity. For selection requirements, see “Materials and Methods.” up, up-regulated genes in almt9-1; down, down-regulated genes in almt9-1. C to E, The expression levels of candidate genes were determined in wt-2, almt9-2, and the complemented lines E196A and GC:ALMT9 by qRT-PCR. The same experimental set-up as for the RNA-seq analysis was used. Transcript abundance of CHX21 (C) and DTX1 (D) was determined in shoots, transcript abundance of HKT1;1 (E) in roots. The data were normalized to the expression level of the respective gene in wt-2 under control conditions. ACT2 served as a reference gene. Each data point was derived from n ≥ 3 biological replicates and is shown as mean ± sd. In C to E, significances at P < 0.05 were analyzed by one-way ANOVA and Tukey-Kramer multiple comparison posttest for each treatment and are indicated by lettering (lowercase for control conditions, capital letters for salinity).

