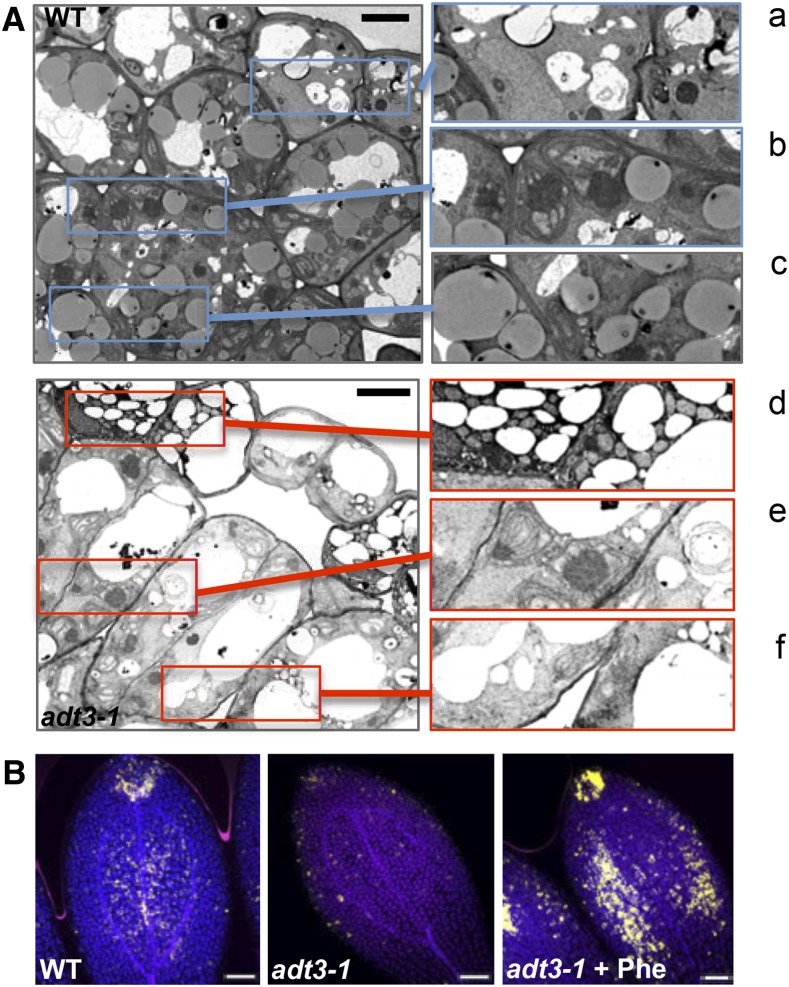
Figure 4.
Ultrastructural phenotypes of adt3-1 epidermal and mesophyll cells. A, TEM micrographs (left) of sections perpendicular to the adaxial surface of the cotyledons of 6-d-old, dark-grown wild-type (WT; top) and adt3-1 (bottom) seedlings. Details of wild-type (a–c) and adt3-1 (d–f) micrographs are shown at right: cytoplasm of epidermal cells (a and c), plastids (b and e), and cytoplasm of mesophyll cells (note the absence of oil bodies in f). n = 5 seedlings (approximately 100 cells). Bars = 5 μm. B, Adaxial side view of mesophyll cells in the cotyledons of 6-d-old, dark-grown wild-type (left), adt3-1 (middle), and adt3-1 + Phe (right) seedlings after staining with Nile Red (false-colored gold). Merges of DAPI (blue), FITC (gold), and Cy5 (pink) are shown. n = 3 (30 seedlings). Bars = 50 μm.

