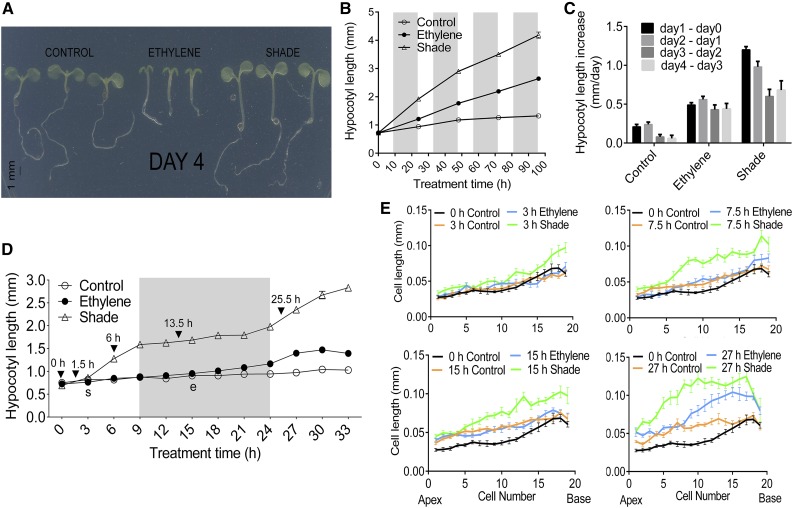
Figure 1.
Physiological responses, hypocotyl lengths, and epidermal cell length kinetics under ethylene and shade in Arabidopsis (Col-0) seedlings. One-day-old seedlings were exposed to control conditions (PAR = 140 μmol m−2 s−1, blue light = 29 μmol m−2 s−1, and R:FR light = 2.1 μmol m−2 s−1), elevated ethylene (1 µL L−1; PAR = 140 μmol m−2 s−1, blue light = 29 μmol m−2 s−1, and R:FR light = 2.1 μmol m−2 s−1), or shade (PAR = 40 μmol m−2 s−1, blue light = 3 μmol m−2 s−1, and R:FR light = 0.45 μmol m−2 s−1). A, Representative seedlings displaying typical phenotypes after 96 h of exposure to control, ethylene, or shade conditions. B, Mean hypocotyl lengths at 0, 24, 48, 72, and 96 h under control (white circles), ethylene (black circles), and shade (triangles). C, Rate of increase in hypocotyl length. Differences between mean hypocotyl lengths of subsequent time points averaged over a 1-d time interval for control, ethylene, and shade are shown. D, Detailed hypocotyl length kinetics. One-day-old seedlings were exposed to control (white circles), ethylene (black circles), and shade (triangles) and measured at 3-h time intervals. Data are means ± se (n = 60) for A to D. Shaded areas denote the 15-h dark period in the 15-h-dark/9-h-light photoperiodic growth condition. e and s denote the first points of statistically significant differences in hypocotyl length or cotyledon area relative to the control for ethylene and shade, respectively. E, Epidermal cell length kinetics. One-day-old seedlings were exposed to control, ethylene, or shade conditions. Mean cell lengths ± se (n ≥ 10) are shown for epidermal cells of the Arabidopsis hypocotyl at 0-h control (black lines) and at 3-, 7.5-, 15-, and 27-h control (orange lines), ethylene (blue lines), and shade (green lines). Apex denotes the hypocotyl-cotyledon junction, and Base denotes the hypocotyl-root junction.

