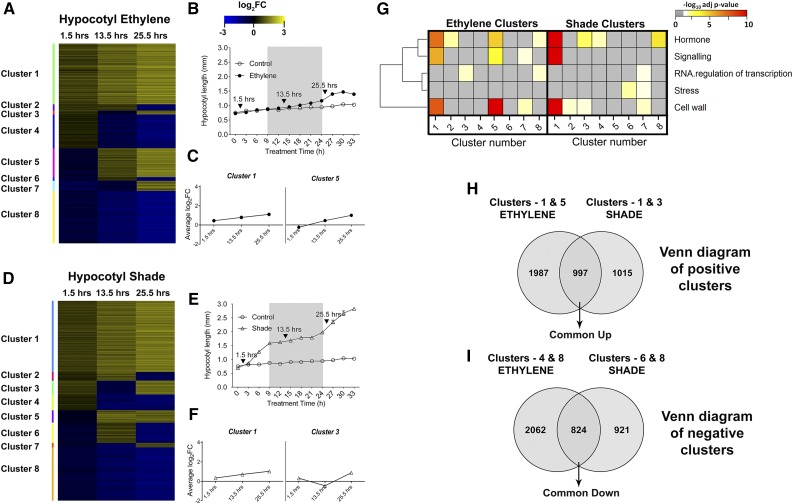
Figure 3.
A to F, Temporal gene expression clusters for ethylene (A) and shade (D), hypocotyl growth curves for ethylene (B) and shade (E), and clusters with gene expression matching hypocotyl growth kinetics in ethylene (C) and shade (F). The heat map for temporal clusters (A and D) was based on the log2FC at the three microarray time points (gray areas represent dark, arrows indicate heat map time points, and treatments include control [white circles], ethylene [black circles], and shade [triangles]). Yellow denotes up-regulation, and blue denotes down-regulation. Two gene expression clusters (C and F) with mean log2FC temporal patterns resembling the hypocotyl length kinetics (B and E) were named positive clusters. G, Heat map for the hypergeometric enrichment of selected MapMan bins for temporal clusters under ethylene and shade. The horizontal axis denotes the cluster number. More intense colors indicate higher statistical significance; gray indicates nonsignificant score or absence of genes in the bin. H, Venn diagram intersection for positive clusters (clusters with gene expression patterns matching the hypocotyl length kinetics) from ethylene and shade to obtain Common Up genes. I, Venn diagram intersection for negative clusters (mirror image to positive clusters) from ethylene and shade to obtain Common Down genes.

