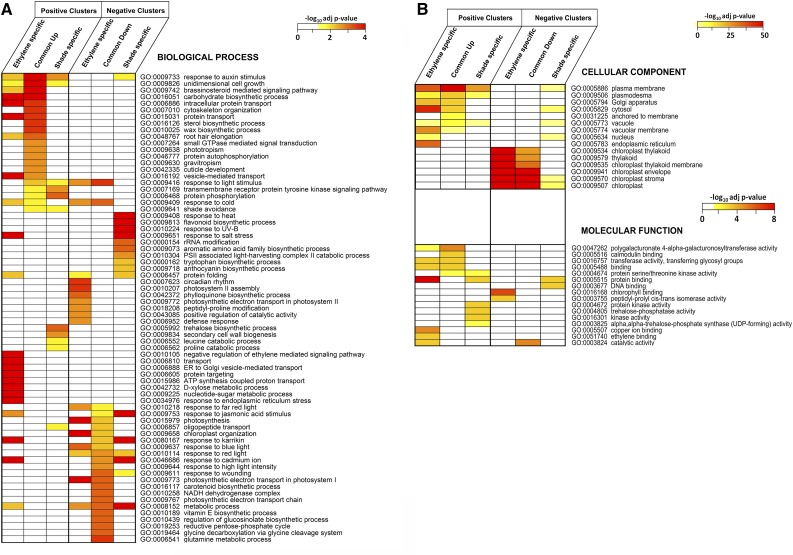
Figure 4.
GO enrichment analysis using GeneCodis for positive and negative clusters. Adjusted P values for statistical significance of GO enrichment were converted into negative logarithm scores (base10; values greater than 1.3 are considered significant). Heat map colors denote this score. More intense colors indicate higher statistical significance; white indicates nonsignificant score or absence of genes in the GO terms. ER, Endoplasmic reticulum.

