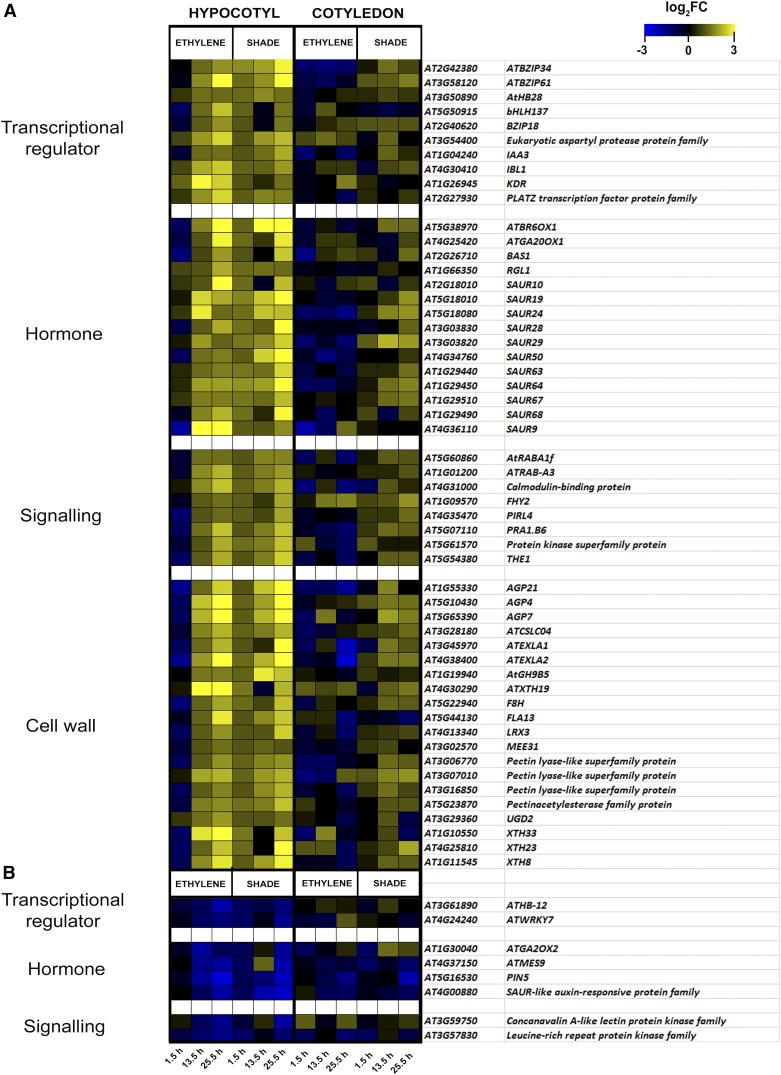
Figure 5.
Heat maps of Common Up (A) and Common Down (B) sets of genes classified into the categories transcriptional regulator, hormone metabolism, signaling, and cell wall genes after the application of a log2FC filter. Log2FC values at the three time points 1.5, 13.5, and 25.5 h for the ethylene and shade microarray data sets are identified in the color scheme of the heat map. Genes were categorized according to MapMan bin gene classification (shown at left).

