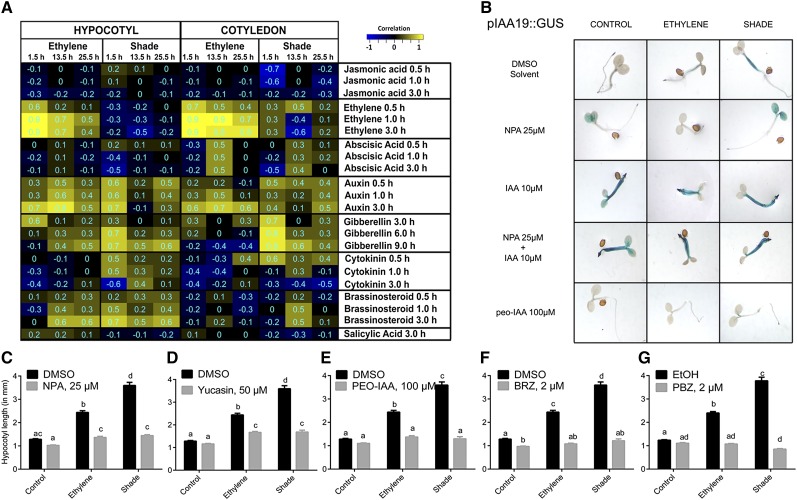
Figure 7.
A, Identification of enriched hormonal signatures in the ethylene- and shade-induced Arabidopsis transcriptome. Ethylene and shade-induced hypocotyl and cotyledon transcriptomes were analyzed for hormonal signatures using the hormonometer tool (Volodarsky et al., 2009) to establish correlations with expression data in an established hormonal transcriptome database. Positive correlations were colored yellow, and negative correlations were colored blue. Significant correlations were identified with absolute correlation values of 0.3 and higher. Numbers in the cells represent exact correlation values. Rows denote hormone treatments that are indicated by the name of the hormone and the duration of hormone treatment. Columns denote ethylene and shade transcriptomes in the hypocotyl and cotyledon at the three time points of tissue harvest. The magnitude of correlation in gene expression is indicated by the color scale at top right. B, Effects of the auxin transport inhibitors NPA (25 µm), IAA (10 µm), and NPA (25 µm) + IAA (10 µm) and the auxin perception inhibitor PEO-IAA (100 µm) on GUS staining of pIAA19:GUS lines. For NPA and PEO-IAA effects in the GUS assay, seedlings were exposed to 2 d of treatment conditions. C to G, Arabidopsis (Col-0) seedlings were treated with chemical inhibitors for auxin transport (NPA; C), auxin biosynthesis (yucasin; D), auxin perception (PEO-IAA; E), BR biosynthesis (brassinazole [BRZ]; F), and GA biosynthesis (paclobutrazol [PBZ]; G) at the indicated concentrations, and hypocotyl length was measured following 96 h of ethylene and shade. Means ± se were calculated for 30 seedlings. Different letters above the bars indicate significant differences from a two-way ANOVA followed by Tukey’s HSD posthoc pairwise comparison. DMSO, Dimethyl sulfoxide; EtOH, ethanol.

