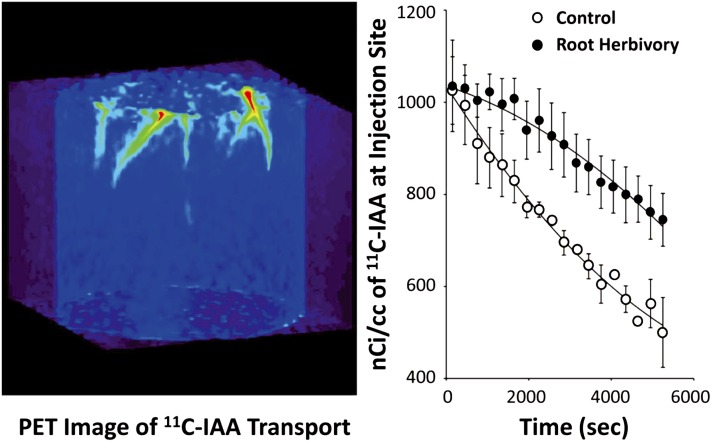
Figure 5.
A, Projection PET image showing [11C]IAA movement from the injection sites in the upper proximal zone of undamaged (control) nodal roots. B, Time-activity plots reflecting levels of decay corrected [11C]IAA activity at the injection site over time in seconds (n = 4, control; n = 5, root herbivory). Root herbivory decreased [11C]IAA transport 2.6-fold from an average speed of 17.0 ± 5.7 mm h−1 as measured from time of arrival of the activity from across two distinct ROIs along an individual root.

