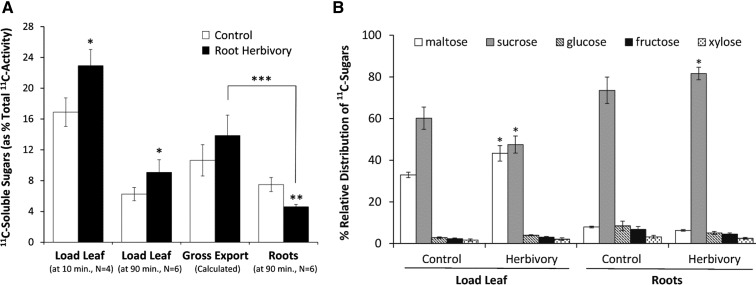
Figure 7.
A, Levels of 11C-labeled soluble sugars (presented as % total 11C activity fixed as 11CO2) were plotted for the following tissues: load leaf at 10 min postadministration of 11CO2, load leaf at 90 min postadministration of 11CO2, and roots at 90 min postadministration of 11CO2 to leaves. The gross export of 11C-labeled soluble sugars was calculated from the difference in load leaf activities at 10 and 90 min. Root herbivore treatment manifested in a significant reduction in root allocation of 11C-labeled soluble sugars. B, Relative distributions of 11C-labeled soluble sugars are presented for the load leaf and roots at 90 min postadministration of 11CO2 and as a function of root herbivore treatment.

