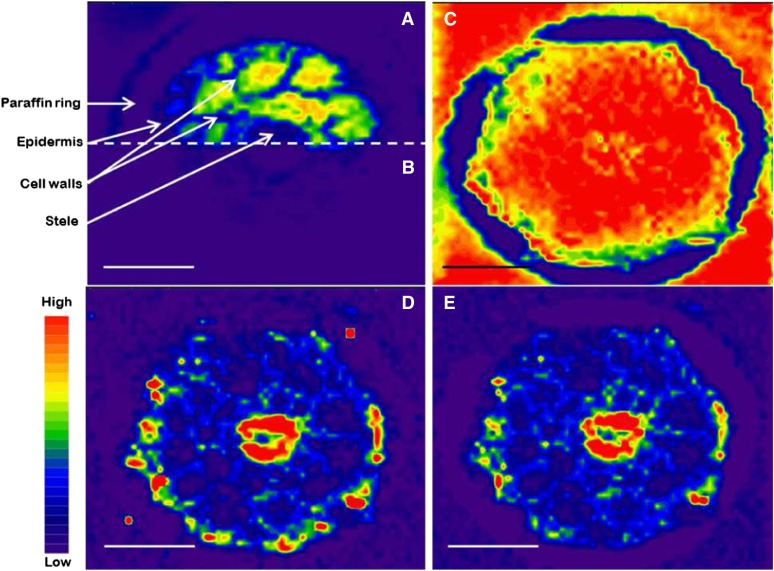
Figure 5.
A, An ion intensity image of 85Rb in the top half of a 20-µm-thick cross section from Arabidopsis roots, analyzed by LA-ICP-MS with 1.4 J cm−2 in the laser beam. B, An ion intensity map of 85Rb in the bottom half of the same section as in A, analyzed with 0.6 J cm−2 in the laser beam. C, An 85Rb ion intensity map analyzed with 2.4 J cm−2 in the laser beam. D, An ion intensity map of 66Zn from the same cross section as in C. E, The distribution and ion intensity of 66Zn in the same cross section as in C, where the values have been corrected, using the 85Rb signal as an internal standard. The color spectrum represents high to low ion intensities (for 85Rb, range, 10–5,000 counts [A–C]; for 66Zn, range, 0–150 counts [D and E]). Bars = 50 µm.

