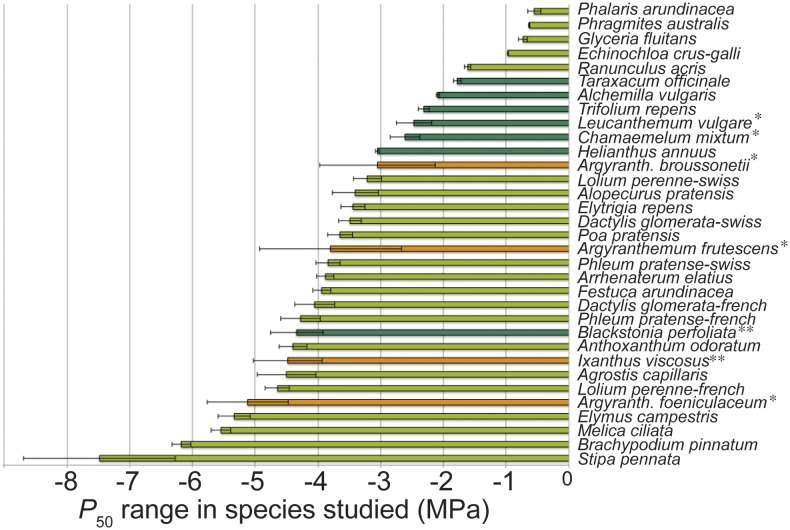
Figure 1.
P50 values of species measured. The range in P50 among the 26 herbaceous and 4 woody species studied varies from −0.5 up to −7.5 MPa. Light-green bars indicate grasses (Poaceae), dark-green bars represent herbaceous eudicots, and the orange ones are woody eudicot shrubs that have evolved from some of the herbaceous relatives studied (*daisy lineage; **gentian lineage). Each bar represents the average value for three specimens of the same species, and error bars show se.

