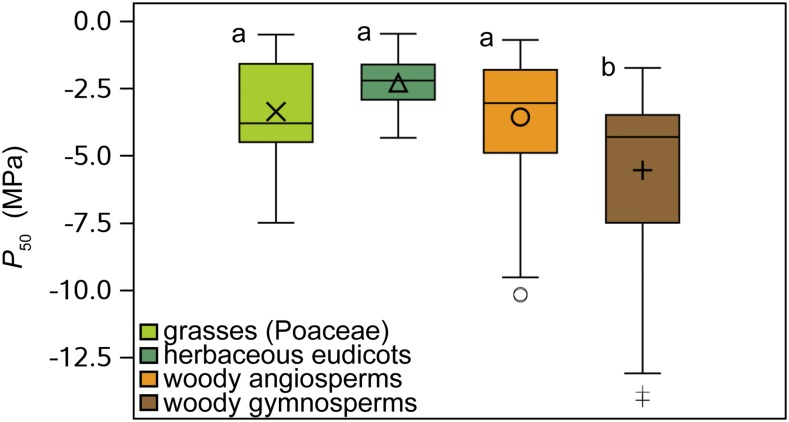
Figure 3.
Box plots showing P50 range among different plant groups. There is a striking similarity in P50 between grasses, herbaceous eudicots, and woody angiosperms. On the other hand, woody gymnosperms have a statistically more negative P50 than each of the angiosperm groups. Mean values are shown with either a cross (grasses), triangle (herbaceous eudicots), circle (woody angiosperms), or plus sign (woody gymnosperms); “a” and “b” indicate statistical differences (Supplemental Table S3).

