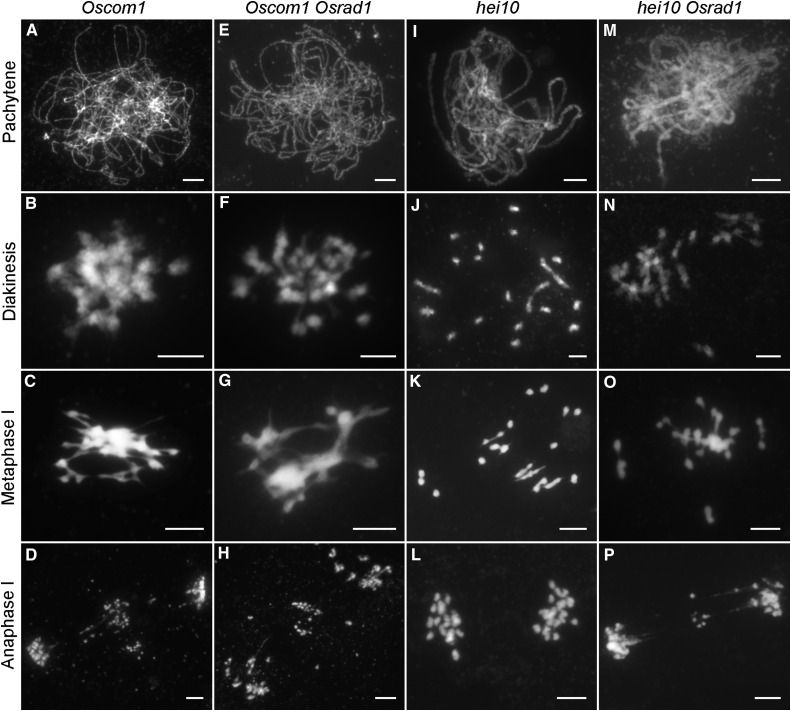
Figure 5.
Genetic analysis of OsRAD1 with OsCOM1 and HEI10. A to D, Oscom1 shows abolished homologous pairing and ectopic associations. E to H, The Oscom1 Osrad1 double mutant displays similar chromosome behaviors to those of the Oscom1 single mutant. I to L, Crossovers formation is disturbed in hei10. M to P, The hei10 Osrad1 double mutant exhibits nonhomologous chromosome associations. Bars = 5 µm.

