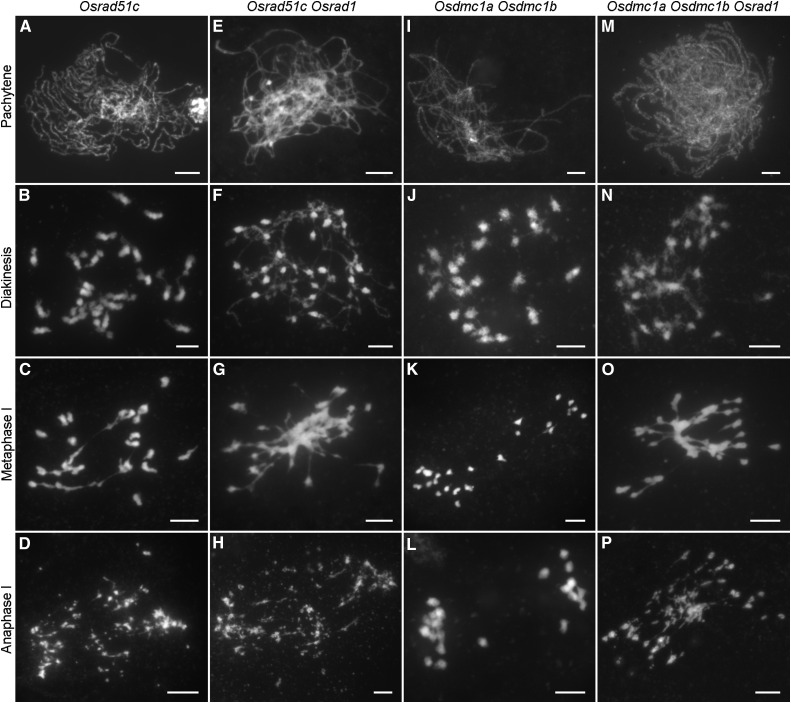
Figure 6.
Genetic analysis of OsRAD1 with OsRAD51C and OsDMC1. A to D, Osrad51c displays asynapsis, univalents, and chromosome fragmentations. I to L, Univalents are observed in the Osdmc1a Osdmc1b double mutant. M to P, The Osdmc1a Osdmc1b Osrad1 triple mutant shows a cumulative effect of the three mutations. Bars = 5 µm.

