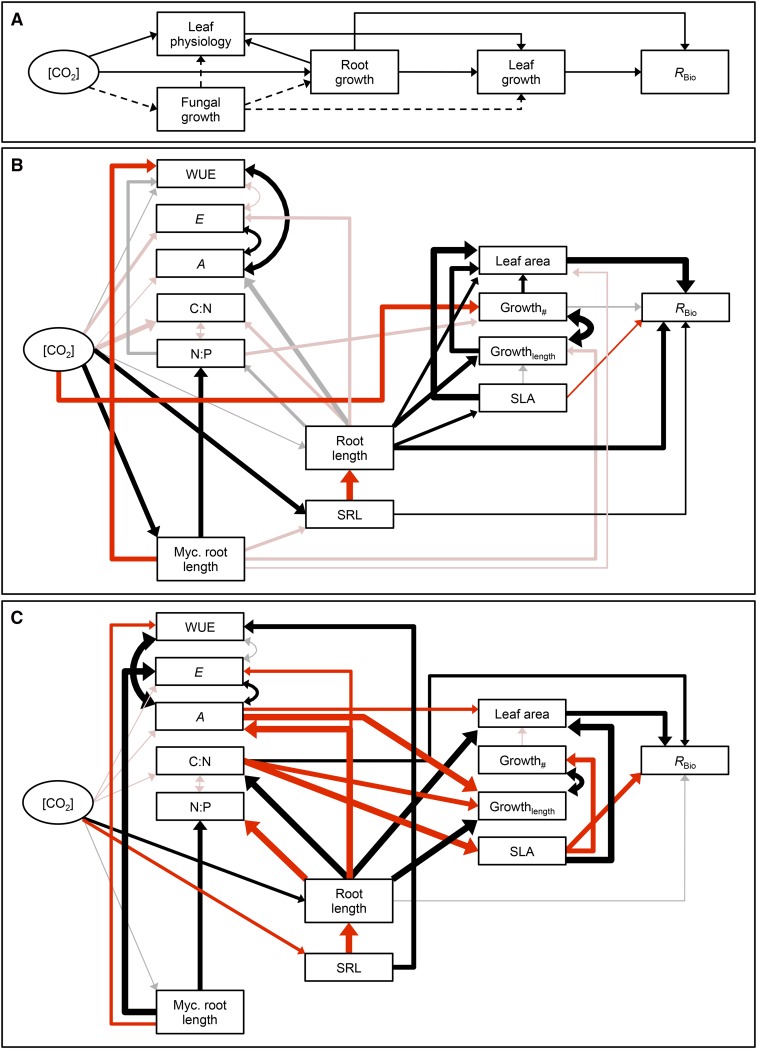
Figure 2.
A, Piecewise structural equation models describing [CO2] effects on RBio via changes in plant and fungal traits. B, Model results for T. ceratophorum indicate that both direct and indirect effects of [CO2] on plant traits contributed to shifts in RBio. C, Model results for T. officinale indicate that primarily direct effects of [CO2] on plant traits contributed to shifts in RBio. In B and C, boxes represent measured traits and solid arrows indicate significant pathways in the model (P < 0.05). Black and red arrows indicate positive and negative correlations, respectively. The thickness of solid arrows was scaled to reflect the magnitude of the standardized regression coefficients. r2 values for each component model and standardized pathway coefficients are listed in Supplemental Table S4.

