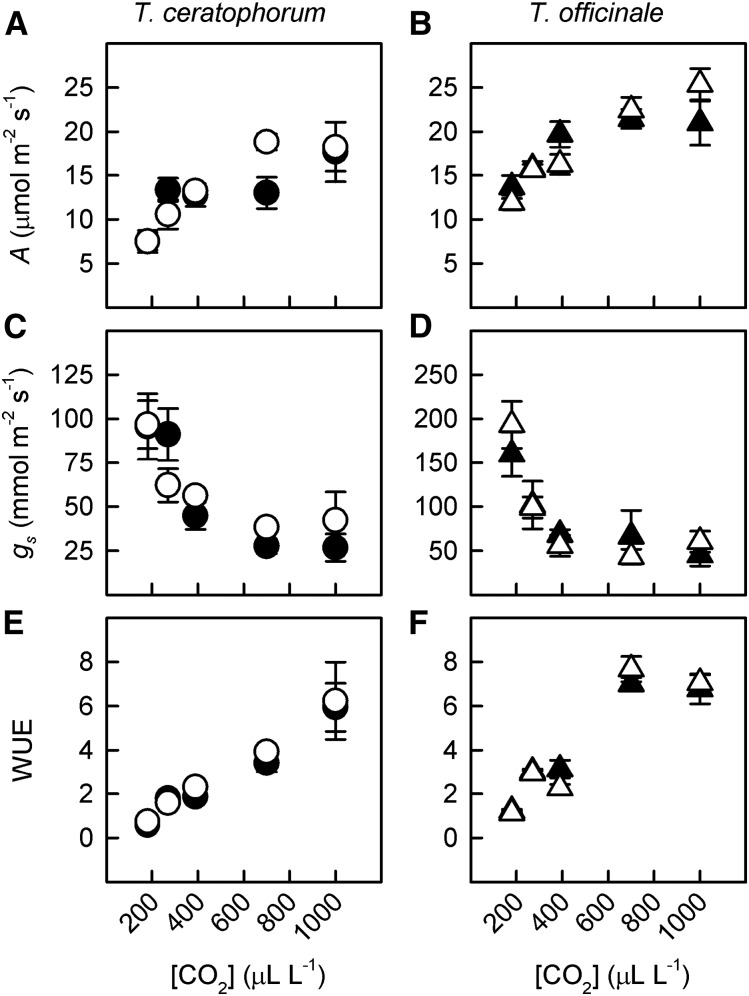
Figure 3.
[CO2] and mycorrhizal effects on leaf gas-exchange rates were similar between T. ceratophorum and T. officinale. Graphs show mean photosynthetic rate (A and B), gs (C and D), and WUE (E and F) for mycorrhizal (black symbols) and control (white symbols) plants.

