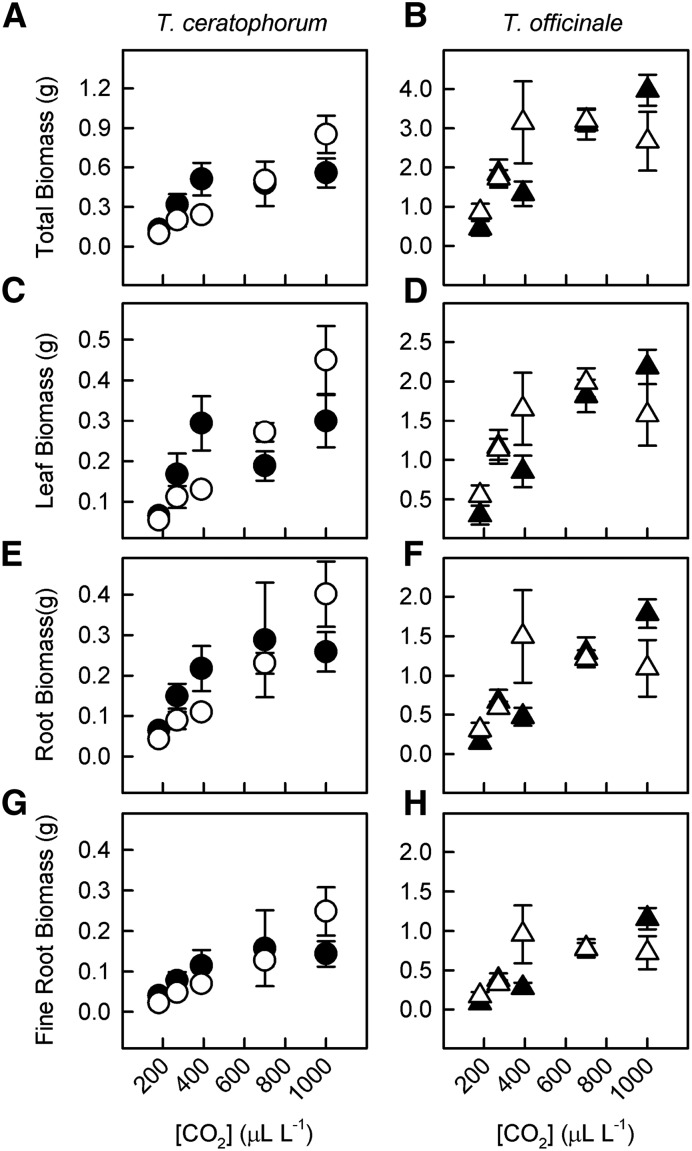
Figure 5.
The relative strength of [CO2] and mycorrhizal effects on plant biomass differed between T. ceratophorum and T. officinale. Graphs show total plant biomass (A and B), leaf biomass (C and D), total root biomass (E and F), and fine root biomass (G and H) for mycorrhizal (black symbols) and control (white symbols) plants. These data were used to calculate the mycorrhizal response ratios shown in Figure 8.

