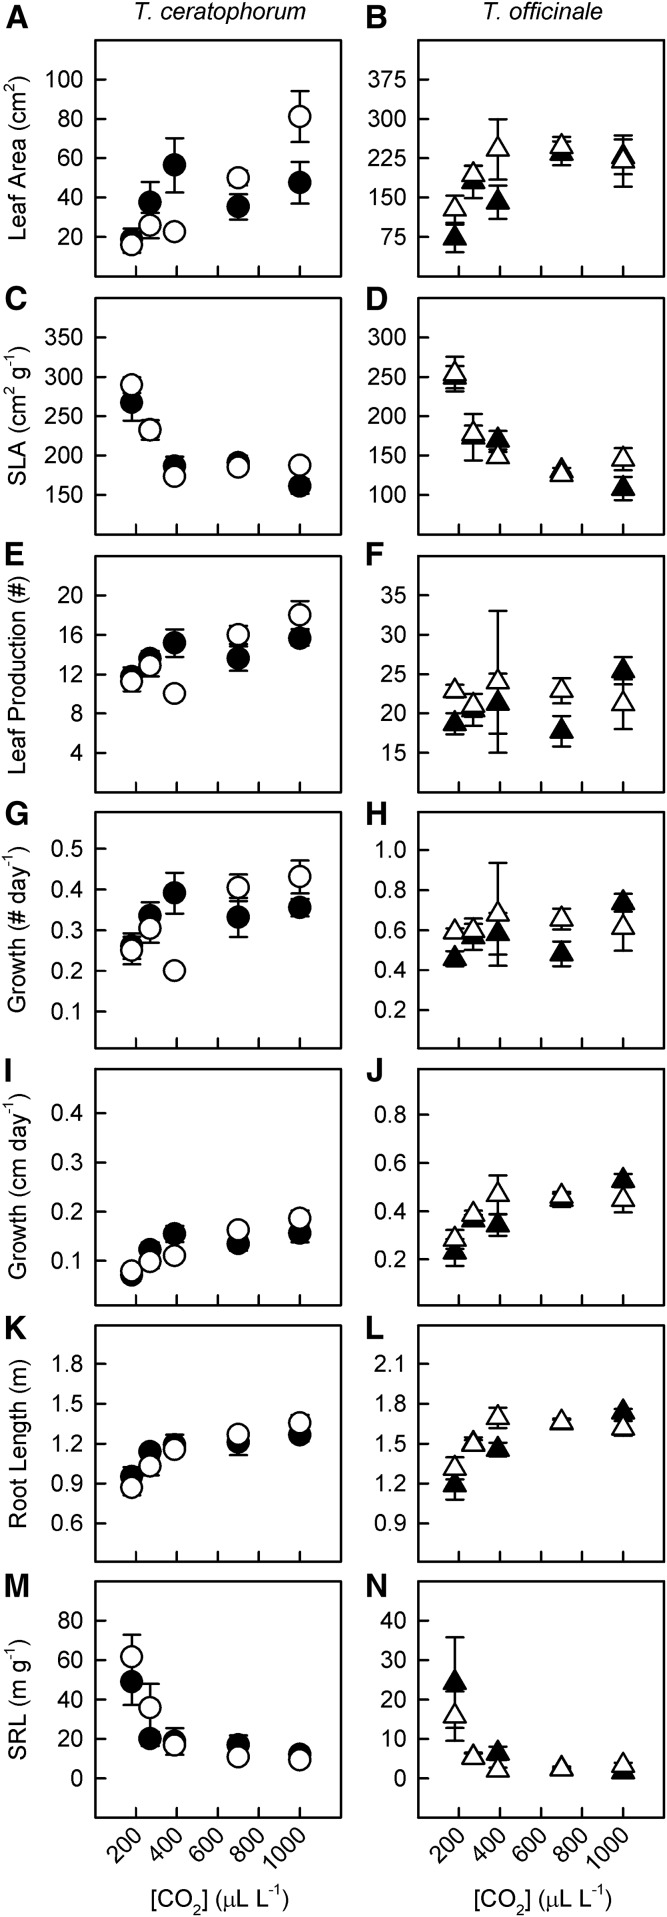
Figure 6.
The relative strength of [CO2] and mycorrhizal effects on leaf and root traits differed between T. ceratophorum and T. officinale. Graphs show mean leaf area (A and B), specific leaf area (C and D), leaf number (E and F), change in leaf number per day (G and H), change in leaf length per day (I and J), total root length (K and L), and specific root length (M and N) for mycorrhizal (black symbols) and control (white symbols) plants.

