Figure 2.
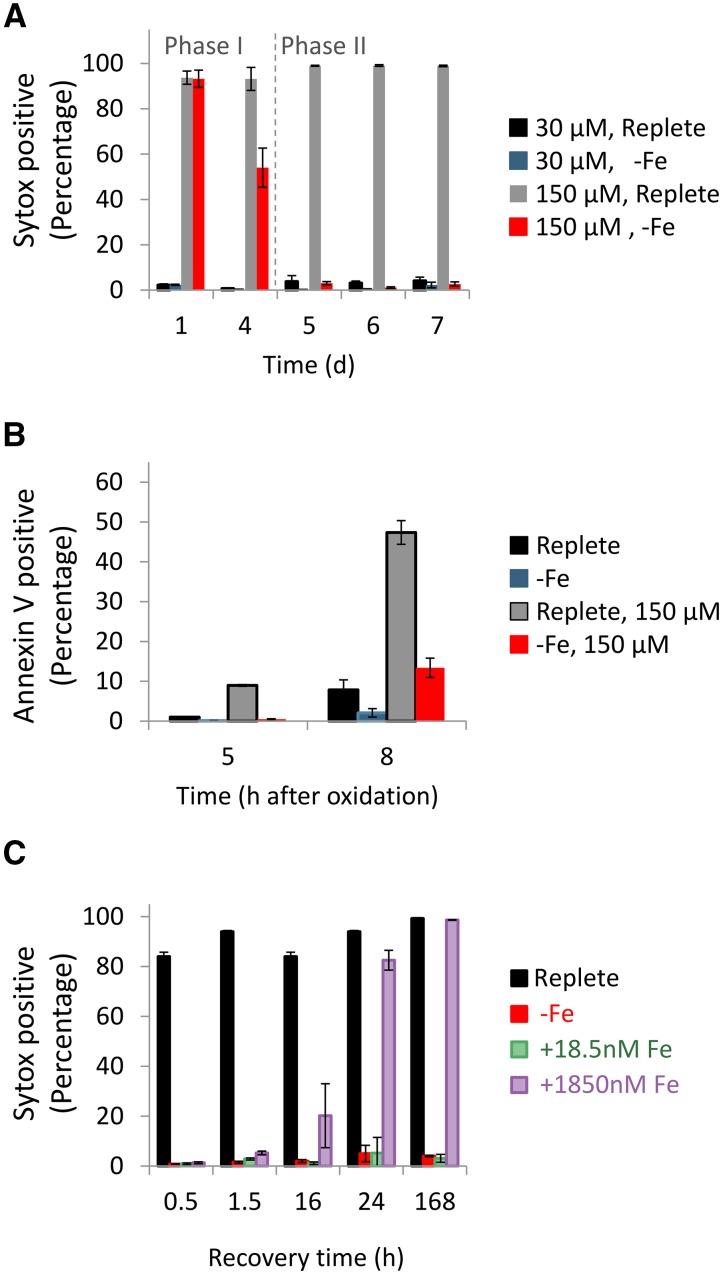
Chronic iron limitation confers transient resistance to oxidative stress in the P. tricornutum. A, Cell death assessed by Sytox staining measured 24 h after treatment with 30 or 150 µM H2O2. The time (days) in the x axis represents the duration of iron limitation, similar to the time depicted in Figure 1. B, Phosphatidyl-Ser externalization measured by Annexin V stain at day 6 of iron limitation. Cells treated with 0 and 150 µM H2O2 were stained with Annexin V at 5 and 8 h posttreatment. C, Cell death assessed by Sytox positive cells, measured 24 h after treatment with 150 µM H2O2. Application of H2O2 was done 0.5, 1.5, 16, 24, and 168 h following iron resupply at day 7 of iron limitation. Flow cytometry analysis is based on fluorescent measurements of at least 5,000 cells per sample. Error bars represent SE of biological triplicates.

