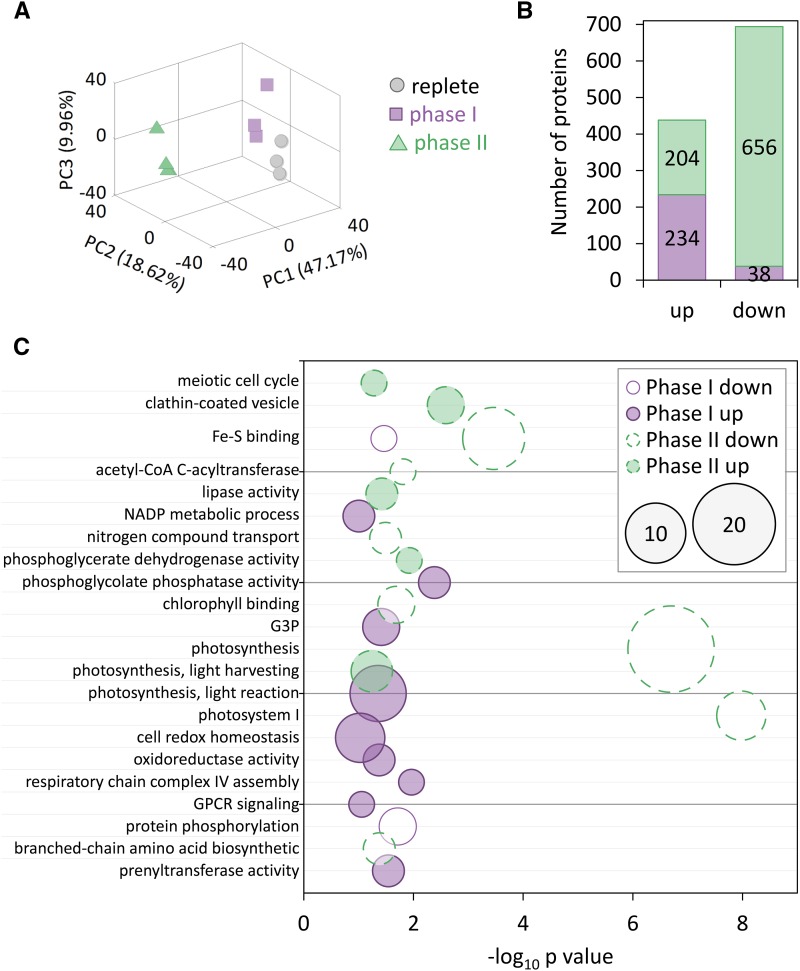
Figure 4.
Global proteomic profiling in P. tricornutum response to iron limitation. A, Principal component analysis of the proteomic data derived from Fe replete (replete, day 3, gray circles), phase I (day 3 of Fe limitation, purple squares), and phase II (day 5 of Fe- limitation, green triangles) cultures. B, Number of differentially expressed proteins (fold change < −1.5 or >1.5, P < 0.05) in phase I (purple, Fe-limited cells on day 3 compared to cells in Fe-replete on day 3) and phase II (green, Fe-limited cells on day 5 compared Fe-limited cells on day 3) cultures. C, Significantly enriched GO terms (hypergeometric test, P < 0.05, down-regulated < −1.5-fold change, up-regulated >1.5-fold change) related to each phase for up- or down-regulated proteins. x Axis represents −log10 of P value, size represents number of genes in each GO term.

