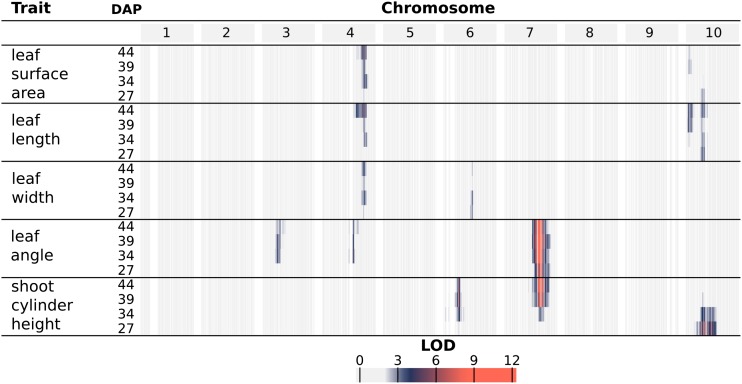
Figure 4.
Log of the odds (LOD) profiles for organ-level traits. For each phenotype, LOD profiles are based on chromosome-wide scans of chromosomes with QTLs based on the most likely multiple-QTL models found by model selection (Supplemental Fig. S6). Each row represents a different trait, and within each trait are four nested rows that each represents a different time point (DAP). Each group of columns represents a chromosome, and each column represents a marker at its genetic position. Cells are colored by marker LOD for the phenotype at the particular time point.

