Figure 5.
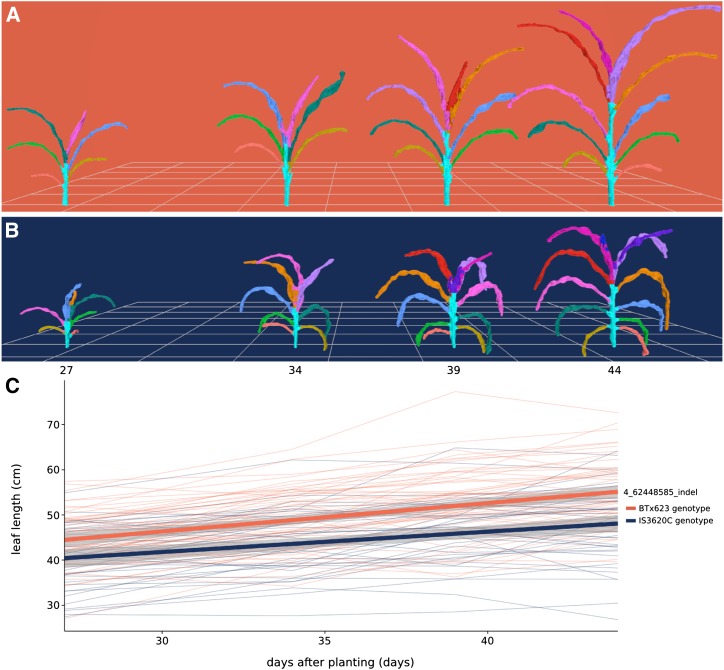
Organ-level measurement of average leaf length over time. A and B, Meshes displaying development over time for a plant bearing BTx623 alleles (A; RIL 257) and a plant bearing IS3620C alleles (B; RIL 306) of an indel marker on chromosome 4 that had the MLOD for leaf length. C, Change in average leaf length over time. Each thin line in the plot represents the average leaf length of a RIL (n = 3) colored by its genotype. Leaf length was calculated as the average of the third, fourth, and fifth leaves counting from the bottom, corresponding to the light green, dark green, and blue leaves in A and B. The two thick lines represent a linear fit for each genotype and 95% confidence intervals.

